EUR/CAD Price Forecast: Trades near 1.4950 after pulling back from monthly highs
- EUR/CAD may retest monthly highs, followed by the two-month high at the 1.5060 level.
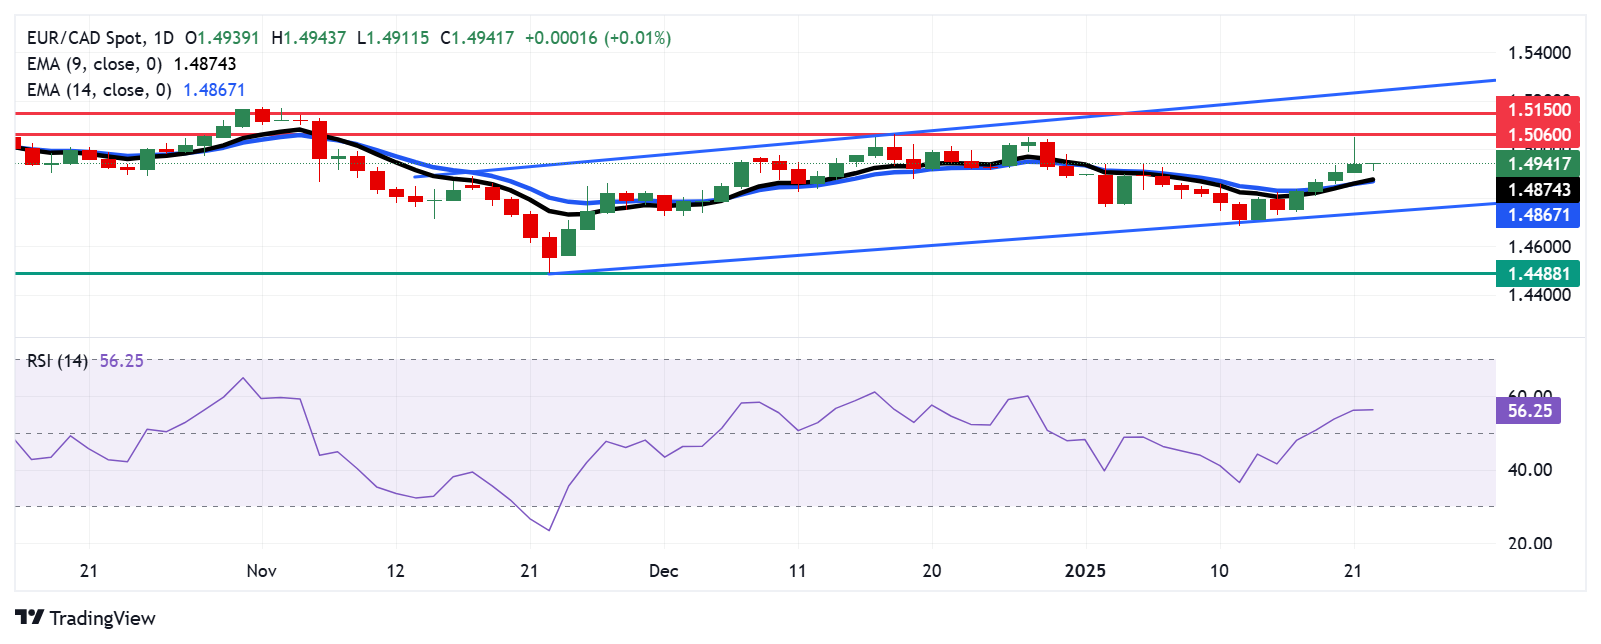
- The 14-day RSI maintains its position above the 50 mark, indicating a persistent bullish momentum.
- The pair could find initial support around the nine-day Exponential Moving Average at 1.4872 level.

EUR/CAD ends its four-day losing streak, trading near 1.4940 during European trading hours on Wednesday. Technical analysis on the daily chart points to a bullish bias, with the currency cross continuing to trade within an ascending channel pattern.
The 14-day Relative Strength Index (RSI), a key measure of overbought or oversold conditions, remains slightly above the 50 mark, signaling ongoing bullish momentum. A further rise in the RSI could reinforce the bullish trend.
If the RSI climbs above the 60 mark, it may indicate stronger upward momentum, potentially pushing EUR/CAD toward the 1.5050–1.5150 range. However, this level could face selling pressure, potentially challenging the strength of the rally.
On the upside, the EUR/CAD cross could test its two-month high at the 1.5060 level, reached on December 18, followed by the "pullback resistance" near 1.5150. A break above this resistance could drive the currency cross toward the upper boundary of the ascending channel at the 1.5250 level.
Support levels for the EUR/CAD cross may be found at the nine-day Exponential Moving Average (EMA) around 1.4872, followed by the 14-day EMA at 1.4866. A break below these levels could weaken short-term price momentum, potentially putting downward pressure on the currency cross.
The downward pressure could lead the EUR/CAD cross to test the lower boundary of the ascending channel at the 1.4750 level, which may act as support, slowing further declines. However, if this level is decisively broken, it would signal a bearish shift, opening the door for EUR/CAD to approach its 11-month low of 1.4488, recorded on November 22.
EUR/CAD: Daily Chart
Euro PRICE Today
The table below shows the percentage change of Euro (EUR) against listed major currencies today. Euro was the weakest against the Australian Dollar.
| USD | EUR | GBP | JPY | CAD | AUD | NZD | CHF | |
|---|---|---|---|---|---|---|---|---|
| USD | -0.08% | -0.07% | 0.19% | -0.07% | -0.09% | -0.01% | -0.06% | |
| EUR | 0.08% | 0.01% | 0.29% | 0.00% | -0.01% | 0.06% | 0.02% | |
| GBP | 0.07% | -0.01% | 0.25% | -0.01% | -0.02% | 0.05% | 0.00% | |
| JPY | -0.19% | -0.29% | -0.25% | -0.25% | -0.27% | -0.21% | -0.25% | |
| CAD | 0.07% | -0.01% | 0.00% | 0.25% | -0.02% | 0.05% | 0.00% | |
| AUD | 0.09% | 0.01% | 0.02% | 0.27% | 0.02% | 0.07% | 0.03% | |
| NZD | 0.01% | -0.06% | -0.05% | 0.21% | -0.05% | -0.07% | -0.05% | |
| CHF | 0.06% | -0.02% | -0.00% | 0.25% | -0.00% | -0.03% | 0.05% |
The heat map shows percentage changes of major currencies against each other. The base currency is picked from the left column, while the quote currency is picked from the top row. For example, if you pick the Euro from the left column and move along the horizontal line to the US Dollar, the percentage change displayed in the box will represent EUR (base)/USD (quote).
Author

Akhtar Faruqui
FXStreet
Akhtar Faruqui is a Forex Analyst based in New Delhi, India. With a keen eye for market trends and a passion for dissecting complex financial dynamics, he is dedicated to delivering accurate and insightful Forex news and analysis.


