- Dow Jones retreats as US manufacturing activity data beats expectations.
- Real Estate and Health sectors are leading losses, while Communication Services and Energy advance.
- DJIA corrects lower after rejection at the 40,000 psychological level.
The Dow Jones Industrial Average (DJIA) is going through a significant pullback on Monday. The positive surprise in the US ISM Manufacturing PMI Index has poured cold water on the US Federal Reserve’s (Fed) easing expectations which has triggered a sharp rebound in US Treasury yields.
The US manufacturing sector’s activity expanded again after more than one year of contraction. The headline PMI rose to 50.3 from 47.8 in March, beating expectations of a milder increase to 48.4. Beyond that, the Prices Paid sub-index surged to 55.8, its highest reading since July 2022 and a positive contribution to inflationary trends.
These figures will likely back Fed hawks’ view that there is no rush to start lowering borrowing costs. This week we have a string of Fed speakers and key employment figures to provide more clues about the central bank’s plans.
Dow Jones news
The Dow Jones Index loses 0.64%, to 39,545 during Monday's afternoon trade, with most sectors in the red. The Real Estate and Health sectors are the biggest losers, dropping 1.46% and 1.06% respectively. On the positive side, Communication Services advances 1.1%, followed by the Energy sector, 0.74% up.
Home Depot (HD) shares are leading the decline with a 3.14% drop to $371.61, followed by Nike (NKE), down 1.93% to $92.17. Boeing (BA) continues bleeding with the company under a major crisis that has led to the replacement of the board. The planemaker loses 1.48% to $190.16.
On the positive side, 3M (MMM) outperformed the rest of the companies in the Index with a 4.55% jump to $92.72, followed by Chevron (CVX), up 0.9% to $159.17.
Dow Jones technical outlook
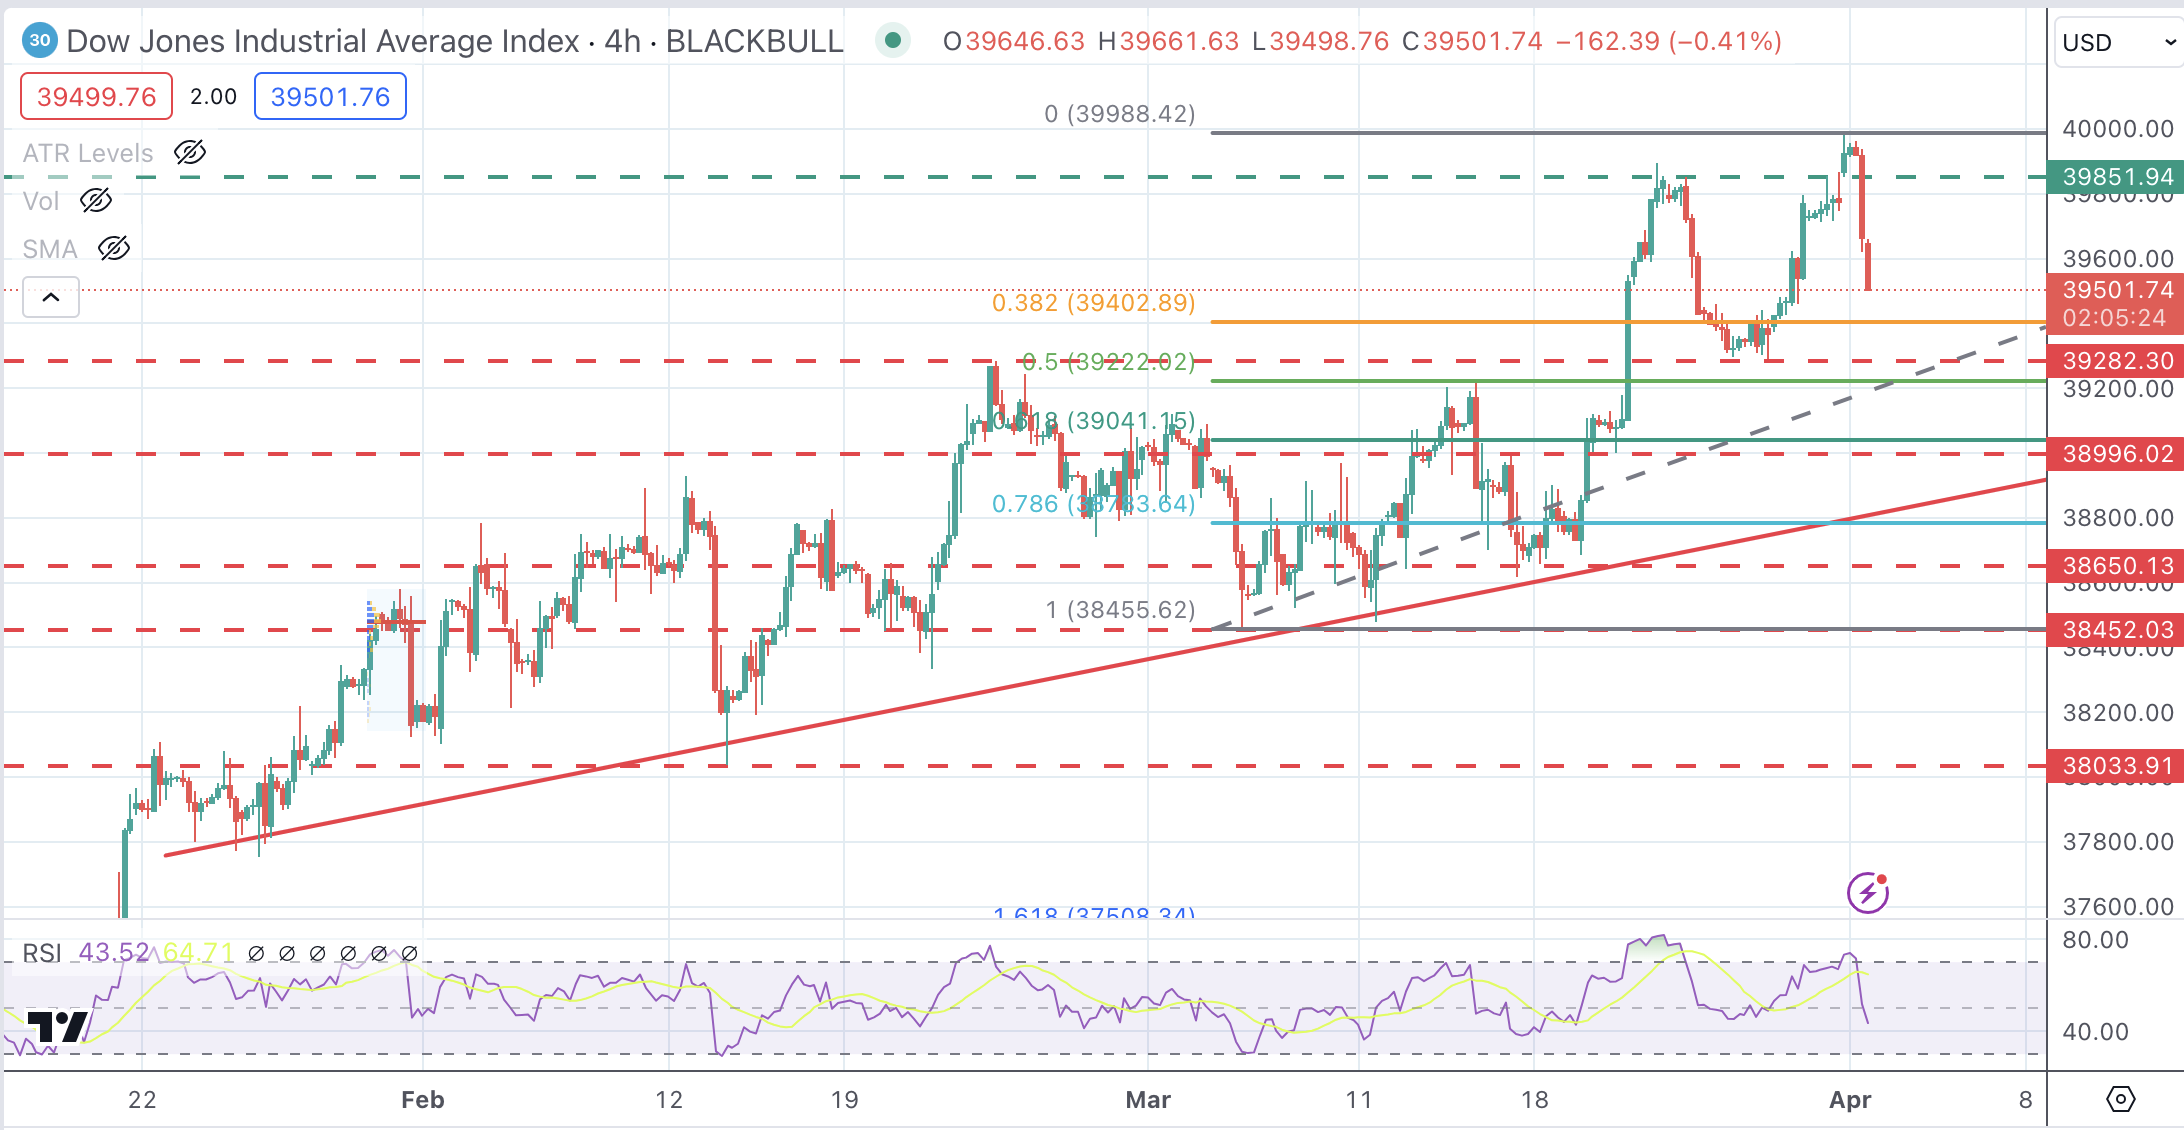
The Dow Jones Index is going through a significant downward correction on Monday, giving away half of the ground taken last week. The overall trend remains bullish, but the pullback from all-time highs gives bears hopes of testing support at the previous resistance level of 39,240.
DJIA remains bullish, standing comfortably above previous highs and the 4-hour 50 Simple Moving Average (SMA) at 39,250. Below here, the next downside targets lie at the 39,000 level and the trendline support at 38,775.
Further down, the trendline resistance from late January lows at 38,850 would be next.
On the upside, the resistance area between 39,850 and the 40,000 psychological levels seems a tough nut to crack for bulls.
DJIA 4-Hour Chart
Nasdaq FAQs
The Nasdaq is a stock exchange based in the US that started out life as an electronic stock quotation machine. At first, the Nasdaq only provided quotations for over-the-counter (OTC) stocks but later it became an exchange too. By 1991, the Nasdaq had grown to account for 46% of the entire US securities’ market. In 1998, it became the first stock exchange in the US to provide online trading. The Nasdaq also produces several indices, the most comprehensive of which is the Nasdaq Composite representing all 2,500-plus stocks on the Nasdaq, and the Nasdaq 100.
The Nasdaq 100 is a large-cap index made up of 100 non-financial companies from the Nasdaq stock exchange. Although it only includes a fraction of the thousands of stocks in the Nasdaq, it accounts for over 90% of the movement. The influence of each company on the index is market-cap weighted. The Nasdaq 100 includes companies with a significant focus on technology although it also encompasses companies from other industries and from outside the US. The average annual return of the Nasdaq 100 has been 17.23% since 1986.
There are a number of ways to trade the Nasdaq 100. Most retail brokers and spread betting platforms offer bets using Contracts for Difference (CFD). For longer-term investors, Exchange-Traded Funds (ETFs) trade like shares that mimic the movement of the index without the investor needing to buy all 100 constituent companies. An example ETF is the Invesco QQQ Trust (QQQ). Nasdaq 100 futures contracts allow traders to speculate on the future direction of the index. Options provide the right, but not the obligation, to buy or sell the Nasdaq 100 at a specific price (strike price) in the future.
Many different factors drive the Nasdaq 100 but mainly it is the aggregate performance of the component companies revealed in their quarterly and annual company earnings reports. US and global macroeconomic data also contributes as it impacts on investor sentiment, which if positive drives gains. The level of interest rates, set by the Federal Reserve (Fed), also influences the Nasdaq 100 as it affects the cost of credit, on which many corporations are heavily reliant. As such the level of inflation can be a major driver too as well as other metrics which impact on the decisions of the Fed.
Information on these pages contains forward-looking statements that involve risks and uncertainties. Markets and instruments profiled on this page are for informational purposes only and should not in any way come across as a recommendation to buy or sell in these assets. You should do your own thorough research before making any investment decisions. FXStreet does not in any way guarantee that this information is free from mistakes, errors, or material misstatements. It also does not guarantee that this information is of a timely nature. Investing in Open Markets involves a great deal of risk, including the loss of all or a portion of your investment, as well as emotional distress. All risks, losses and costs associated with investing, including total loss of principal, are your responsibility. The views and opinions expressed in this article are those of the authors and do not necessarily reflect the official policy or position of FXStreet nor its advertisers. The author will not be held responsible for information that is found at the end of links posted on this page.
If not otherwise explicitly mentioned in the body of the article, at the time of writing, the author has no position in any stock mentioned in this article and no business relationship with any company mentioned. The author has not received compensation for writing this article, other than from FXStreet.
FXStreet and the author do not provide personalized recommendations. The author makes no representations as to the accuracy, completeness, or suitability of this information. FXStreet and the author will not be liable for any errors, omissions or any losses, injuries or damages arising from this information and its display or use. Errors and omissions excepted.
The author and FXStreet are not registered investment advisors and nothing in this article is intended to be investment advice.
Recommended content
Editors’ Picks
EUR/USD stays in positive territory above 1.0850 after US data

EUR/USD clings to modest daily gains above 1.0850 in the second half of the day on Friday. The improving risk mood makes it difficult for the US Dollar to hold its ground after PCE inflation data, helping the pair edge higher ahead of the weekend.
GBP/USD stabilizes above 1.2850 as risk mood improves

GBP/USD maintains recovery momentum and fluctuates above 1.2850 in the American session on Friday. The positive shift seen in risk mood doesn't allow the US Dollar to preserve its strength and supports the pair.
Gold rebounds above $2,380 as US yields stretch lower

Following a quiet European session, Gold gathers bullish momentum and trades decisively higher on the day above $2,380. The benchmark 10-year US Treasury bond yield loses more than 1% on the day after US PCE inflation data, fuelling XAU/USD's upside.
Avalanche price sets for a rally following retest of key support level

Avalanche (AVAX) price bounced off the $26.34 support level to trade at $27.95 as of Friday. Growing on-chain development activity indicates a potential bullish move in the coming days.
The election, Trump's Dollar policy, and the future of the Yen

After an assassination attempt on former President Donald Trump and drop out of President Biden, Kamala Harris has been endorsed as the Democratic candidate to compete against Trump in the upcoming November US presidential election.