Dow Jones Industrial Average sheds over 600 points in second-worst day of 2024
- Dow Jones declined over a full percent, falls further away from 40,000.00.
- US Services PMI rose to a 12-month high, in a cautionary reminder of services inflation.
- Investors will be hoping for good news from Friday’s US Durable Goods Orders.

The Dow Jones Industrial Average (DJIA) tumbled on Thursday, falling over 600 points and slipping back to the 39,000.00 level as investors pulled back in the face of declining hopes for a September interest rate cut from the Federal Reserve (Fed).
May’s S&P Global Services Purchasing Managers Index (PMI) rose to a 12-month high of 50.9 on Thursday, well above the forecast steady print at 50.0. Accelerating services activity bodes poorly for investors desperate for signs of a rate trim from the Fed. Fitch Ratings warned the entire market on Wednesday that services inflation will likely remain sticky for some time, keeping rates elevated for much longer than many investors have been hoping for.
Read more: US S&P Global Manufacturing PMI surprised to the upside in May
According to the CME’s FedWatch Tool, rate traders are pricing in barely 50% odds of at least a quarter-point cut from the Fed in September, down significantly from the 70% odds priced in at the beginning of the trading week. US data will have one last chance to throw investors a bone on Friday, with US Durable Goods on the table.
US Durable Goods in April are expected to decline -0.8% MoM, down sharply from the previous month’s 2.6%. The University of Michigan’s Consumer Sentiment Index in May is forecast to tick upwards to 67.5 from the previous period’s 67.4, while UoM 5-year Consumer Inflation Expectations are expected to remain pinned at 3.1% in May.
Dow Jones news
The Dow Jones is sharply lower on Thursday as the US market’s worst-performing equity index. All of the Dow Jones' constituent securities are in the red for the day, with losses led by Boeing Co. (BA), which is getting absolutely shattered. BA tumbled -7.5% to $172.40 per share after the company announced negative cash flow with no expectations of the battered airplane manufacturer’s deliveries recovering in the second quarter.
Dow Jones technical outlook
The Dow Jones sees accelerating losses as the index turns even more bearish on the day, falling back from record highs above 40,000.00. Thursday has seen incredibly one-sided intraday action, tumbling from the day’s early peaks near 39,760.00.
The DJIA is slipping back towards the 50-day Exponential Moving Average (EMA) at 38,908.36. Despite near-term declines, the index is still buried deep in bull country, with the index trading well above the 200-day EMA at 37,141.05.
Dow Jones five minute chart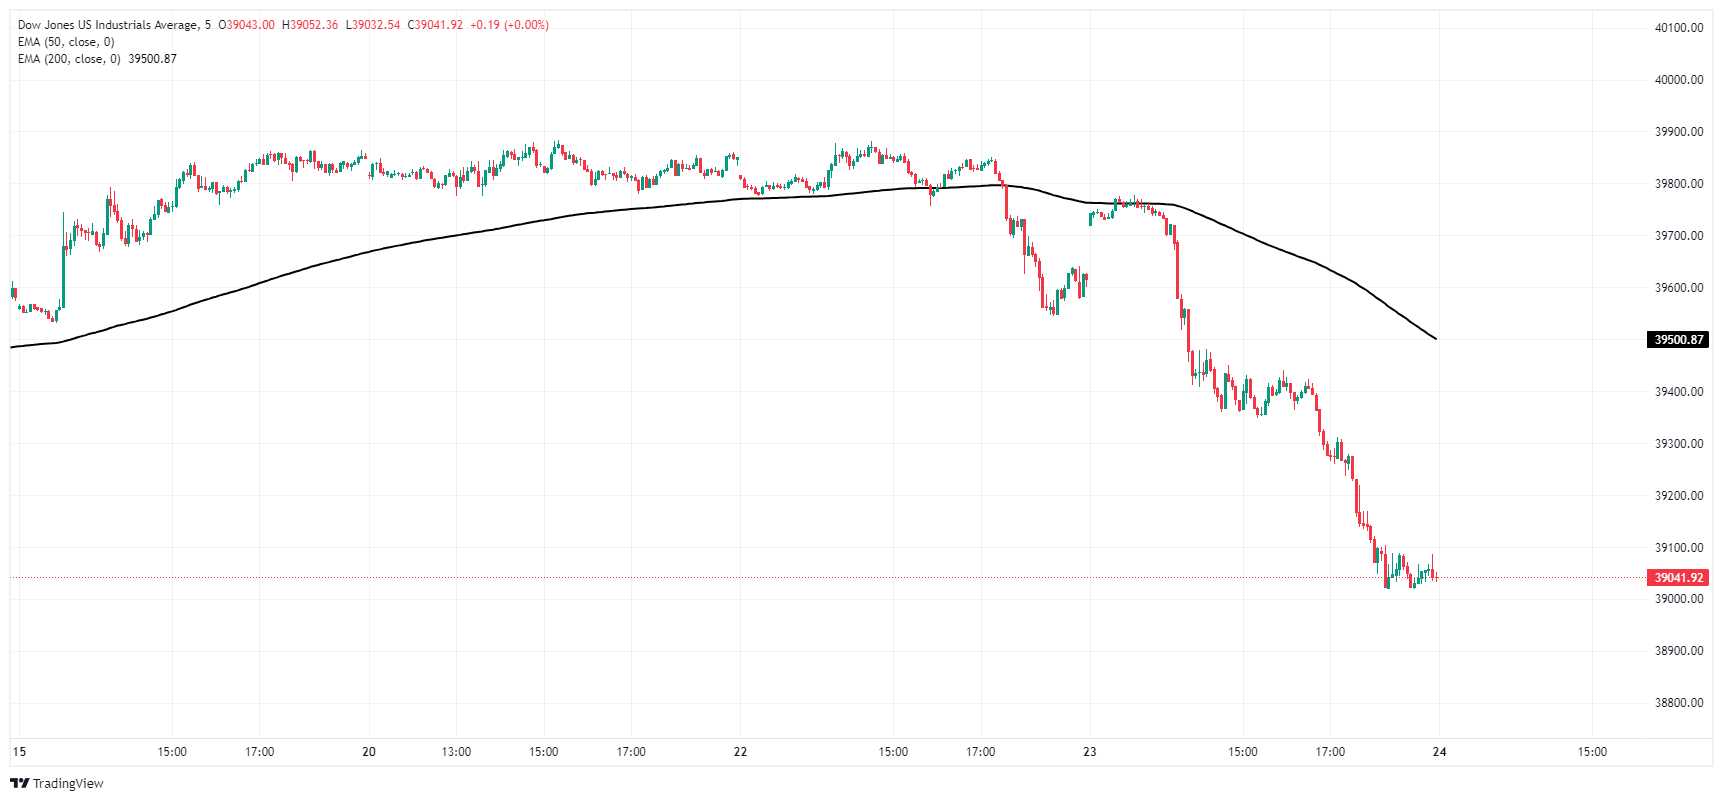
Dow Jones daily chart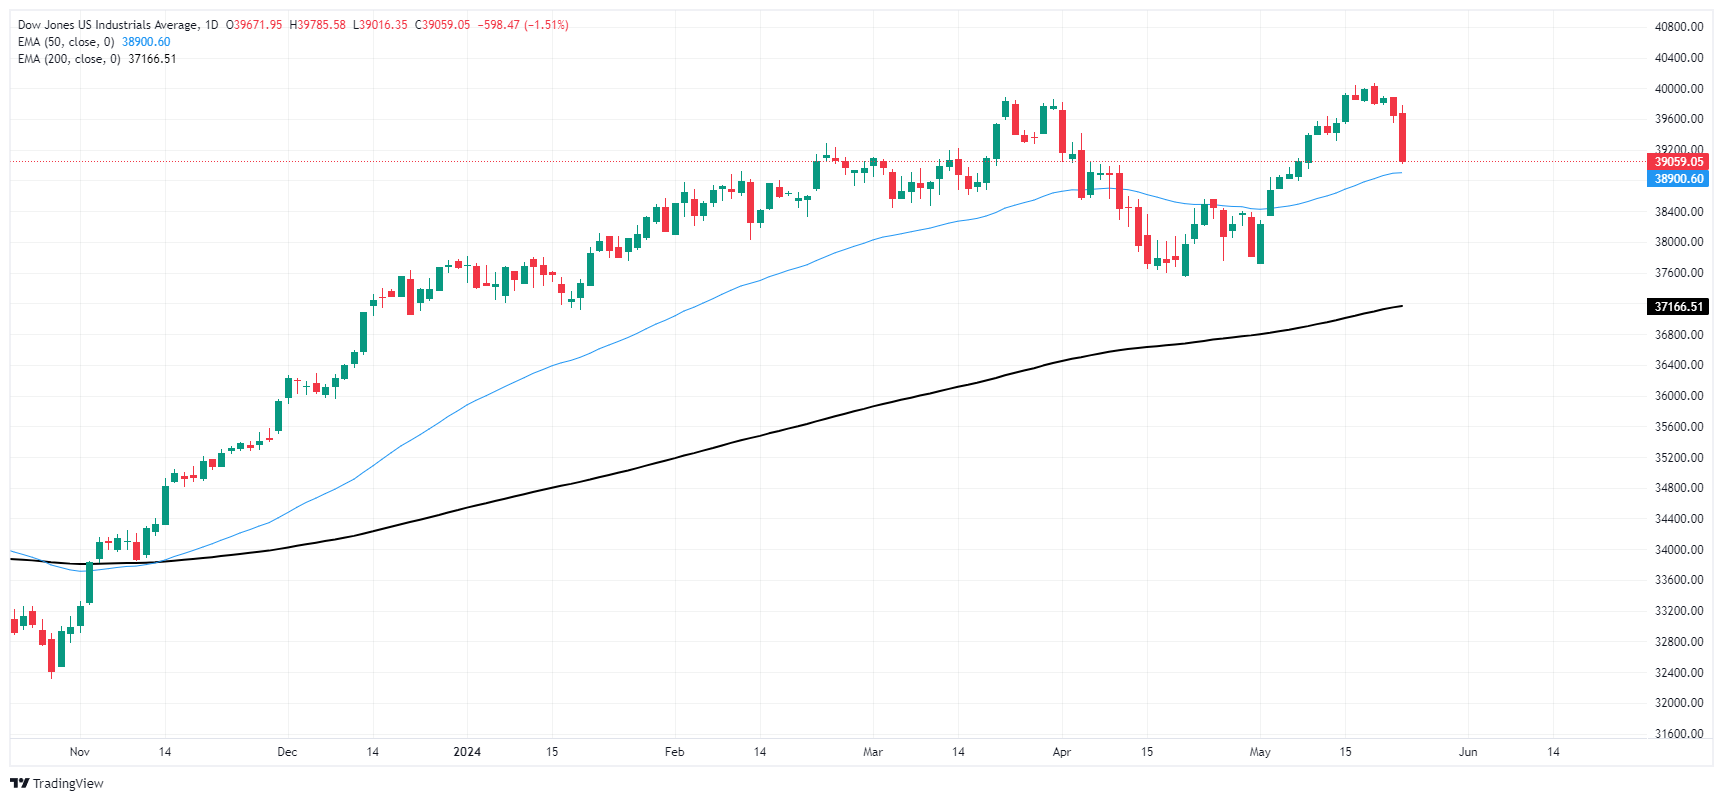
Dow Jones FAQs
The Dow Jones Industrial Average, one of the oldest stock market indices in the world, is compiled of the 30 most traded stocks in the US. The index is price-weighted rather than weighted by capitalization. It is calculated by summing the prices of the constituent stocks and dividing them by a factor, currently 0.152. The index was founded by Charles Dow, who also founded the Wall Street Journal. In later years it has been criticized for not being broadly representative enough because it only tracks 30 conglomerates, unlike broader indices such as the S&P 500.
Many different factors drive the Dow Jones Industrial Average (DJIA). The aggregate performance of the component companies revealed in quarterly company earnings reports is the main one. US and global macroeconomic data also contributes as it impacts on investor sentiment. The level of interest rates, set by the Federal Reserve (Fed), also influences the DJIA as it affects the cost of credit, on which many corporations are heavily reliant. Therefore, inflation can be a major driver as well as other metrics which impact the Fed decisions.
Dow Theory is a method for identifying the primary trend of the stock market developed by Charles Dow. A key step is to compare the direction of the Dow Jones Industrial Average (DJIA) and the Dow Jones Transportation Average (DJTA) and only follow trends where both are moving in the same direction. Volume is a confirmatory criteria. The theory uses elements of peak and trough analysis. Dow’s theory posits three trend phases: accumulation, when smart money starts buying or selling; public participation, when the wider public joins in; and distribution, when the smart money exits.
There are a number of ways to trade the DJIA. One is to use ETFs which allow investors to trade the DJIA as a single security, rather than having to buy shares in all 30 constituent companies. A leading example is the SPDR Dow Jones Industrial Average ETF (DIA). DJIA futures contracts enable traders to speculate on the future value of the index and Options provide the right, but not the obligation, to buy or sell the index at a predetermined price in the future. Mutual funds enable investors to buy a share of a diversified portfolio of DJIA stocks thus providing exposure to the overall index.
Author

Joshua Gibson
FXStreet
Joshua joins the FXStreet team as an Economics and Finance double major from Vancouver Island University with twelve years' experience as an independent trader focusing on technical analysis.


