Dow Jones Industrial Average tiptoes into another record high on Friday
- The Dow Jones tested further into record territory despite a lack of momentum.
- Q3 earnings season bolstered investor confidence as earnings broadly beat expectations.
- US economic data further buoyed risk appetite as recession fears evaporate.

The Dow Jones Industrial Average (DJIA) tested cautiously into higher ground on Friday, clipping into another record high and keeping the needle pinned firmly into the bullish side. Equities broadly lifted higher as Q3 earnings season sees most companies out-earning market expectations, and upbeat US economic data this week has trounced fears of a near-term recession.
Q3 earnings season got off to a strong start this week. The banking sector in particular outran market expectations, with most large commercial banks out-earning analyst forecasts. The AI tech bull market is also back in full swing after key chipmaker suppliers reported strong demand heading into the fourth quarter and Q1 2025. Markets recently buckled on tech stocks after fears emerged the AI sector may be facing a slowdown, but still-strong demand for chip-making materials has tilted bullish sentiment upright once again.
US housing and construction figures came in moderately mixed on Friday, further entrenching investors in a buying mood and further crushing any fears of an economic slowdown right around the corner. The US’ “soft landing” scenario appears to have been fully averted with growth and activity metrics easily beating expectations, and upbeat Retail Sales figures releases earlier this week further make the case.
Dow Jones news
Despite thin gains on Friday, most of the Dow Jones board is testing into the green for the day. A scant third of the DJIA are trapped on the low side. Apple (AAPL) stretched 1.5% higher, climbing above $235 per share after analyst reports revealed that Apple iPhone sales are soaring by 20% in China.
On the low side, American Express (AXP) backslid by 3%, falling below $277 per share after the major payments company missed market expectations for Q3 revenues.
Dow Jones price forecast
Intraday bids on the Dow Jones crossed 43,300 for the first time ever on Friday, setting a record high for the fourth time this week. The major equity index has climbed over 16.6% bottom-to-top from 2024’s early lows near 37,140, and price action has fully outpaced the 200-day Exponential Moving Average (EMA) since November of 2023.
An extended push into overbought territory leaves the Dow Jones primed for a downside pullback to the 50-day EMA just south of the 42,000 price handle. However, short interest is poised to struggle with finding a foothold as equity bulls remain in full control.
Dow Jones daily chart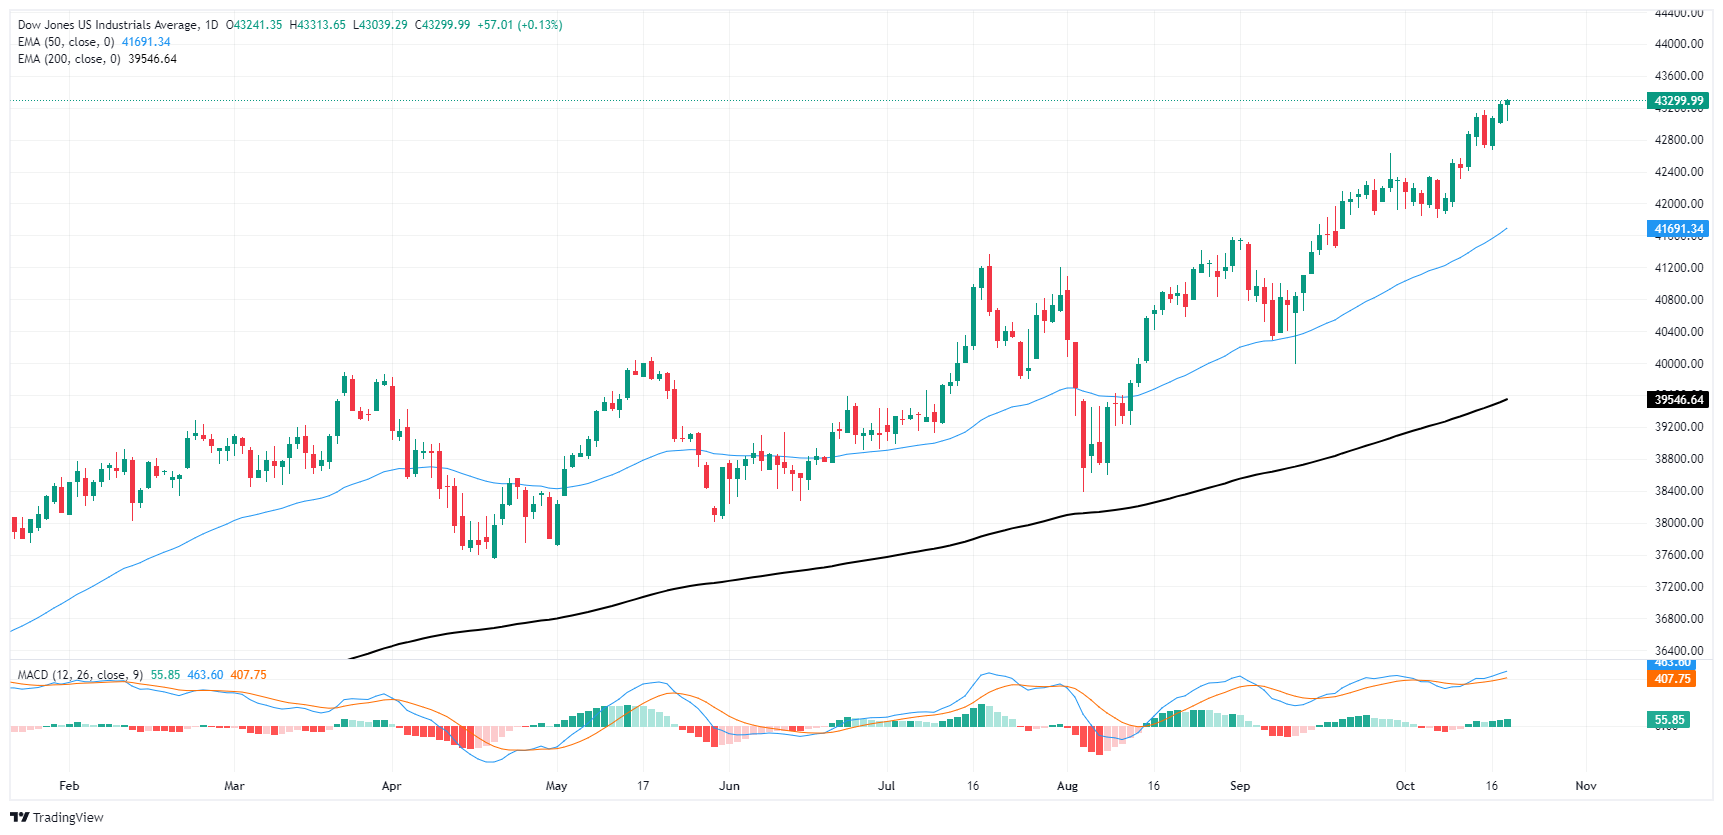
Dow Jones FAQs
The Dow Jones Industrial Average, one of the oldest stock market indices in the world, is compiled of the 30 most traded stocks in the US. The index is price-weighted rather than weighted by capitalization. It is calculated by summing the prices of the constituent stocks and dividing them by a factor, currently 0.152. The index was founded by Charles Dow, who also founded the Wall Street Journal. In later years it has been criticized for not being broadly representative enough because it only tracks 30 conglomerates, unlike broader indices such as the S&P 500.
Many different factors drive the Dow Jones Industrial Average (DJIA). The aggregate performance of the component companies revealed in quarterly company earnings reports is the main one. US and global macroeconomic data also contributes as it impacts on investor sentiment. The level of interest rates, set by the Federal Reserve (Fed), also influences the DJIA as it affects the cost of credit, on which many corporations are heavily reliant. Therefore, inflation can be a major driver as well as other metrics which impact the Fed decisions.
Dow Theory is a method for identifying the primary trend of the stock market developed by Charles Dow. A key step is to compare the direction of the Dow Jones Industrial Average (DJIA) and the Dow Jones Transportation Average (DJTA) and only follow trends where both are moving in the same direction. Volume is a confirmatory criteria. The theory uses elements of peak and trough analysis. Dow’s theory posits three trend phases: accumulation, when smart money starts buying or selling; public participation, when the wider public joins in; and distribution, when the smart money exits.
There are a number of ways to trade the DJIA. One is to use ETFs which allow investors to trade the DJIA as a single security, rather than having to buy shares in all 30 constituent companies. A leading example is the SPDR Dow Jones Industrial Average ETF (DIA). DJIA futures contracts enable traders to speculate on the future value of the index and Options provide the right, but not the obligation, to buy or sell the index at a predetermined price in the future. Mutual funds enable investors to buy a share of a diversified portfolio of DJIA stocks thus providing exposure to the overall index.
Author

Joshua Gibson
FXStreet
Joshua joins the FXStreet team as an Economics and Finance double major from Vancouver Island University with twelve years' experience as an independent trader focusing on technical analysis.


