Dow Jones Industrial Average grinds out another all-time high despite lackluster Monday action
- The Dow Jones clipped into an all-new record peak, but remains flat overall.
- Equities are tilted upwards, but overall market momentum remains limited.
- US S&P PMI figures came in mixed on Monday, but Fedspeak dominates.
The Dow Jones Industrial Average (DJIA) tested into a fresh record bid on Monday, but middling US data prints and cautious Fedspeak early in the day have kept risk appetite restrained. S&P US Purchasing Managers Index (PMI) figures printed on both sides of median market forecasts, and Federal Reserve (Fed) Bank of Chicago President Austan Goolsbee warned that despite the Fed’s extra-wide initial rate cut this month, further moves on the Fed’s reference rate could be needed over the next year to head off a potential deterioration of the US labor market.
September’s S&P US Manufacturing PMI declined to 47.0 MoM, falling to its lowest level since July of 2023 as the US manufacturing sector sees a continued gloomy outlook on business activity. On the other hand, the S&P US Services PMI eased to 55.4 in September, down from August’s 55.7 but beating the expected print of 55.2.
Fed policymaker and Chicago Fed President Austan Goolsbee hit markets with cooling comments early Monday, noting that much further movement on rates from the Fed could be necessary. The Fed official highlighted that the Fed may need to shoot much lower on policy rates in order to keep business lending conditions sufficiently liquid enough to keep the US business landscape keel-side down as record tightness in the US labor market drains away.
Economic Indicator
S&P Global Manufacturing PMI
The S&P Global Manufacturing Purchasing Managers Index (PMI), released on a monthly basis, is a leading indicator gauging business activity in the US manufacturing sector. The data is derived from surveys of senior executives at private-sector companies from the manufacturing sector. Survey responses reflect the change, if any, in the current month compared to the previous month and can anticipate changing trends in official data series such as Gross Domestic Product (GDP), industrial production, employment and inflation. A reading above 50 indicates that the manufacturing economy is generally expanding, a bullish sign for the US Dollar (USD). Meanwhile, a reading below 50 signals that activity in the manufacturing sector is generally declining, which is seen as bearish for USD.
Read more.Last release: Mon Sep 23, 2024 13:45 (Prel)
Frequency: Monthly
Actual: 47
Consensus: 48.5
Previous: 47.9
Source: S&P Global
Dow Jones news
Roughly half of the Dow Jones index tested the low side on Monday, forcing the equity board to middle on headline figures. Intel (INTC) rose nearly 3% early in the day after it was reported that Apollo Global Management has floated a $5 billion investment in Intel, which signaled that investors are growing confident that the chipmaker may be able to turn around their recent backslide. The investment exploration from (AGM) also helped to head off a possible acquisition bid from Intel’s immediate competitor in the silicon space, Qualcomm, which recently looked into purchasing the entirety of Intel outright.
Dow Jones price forecast
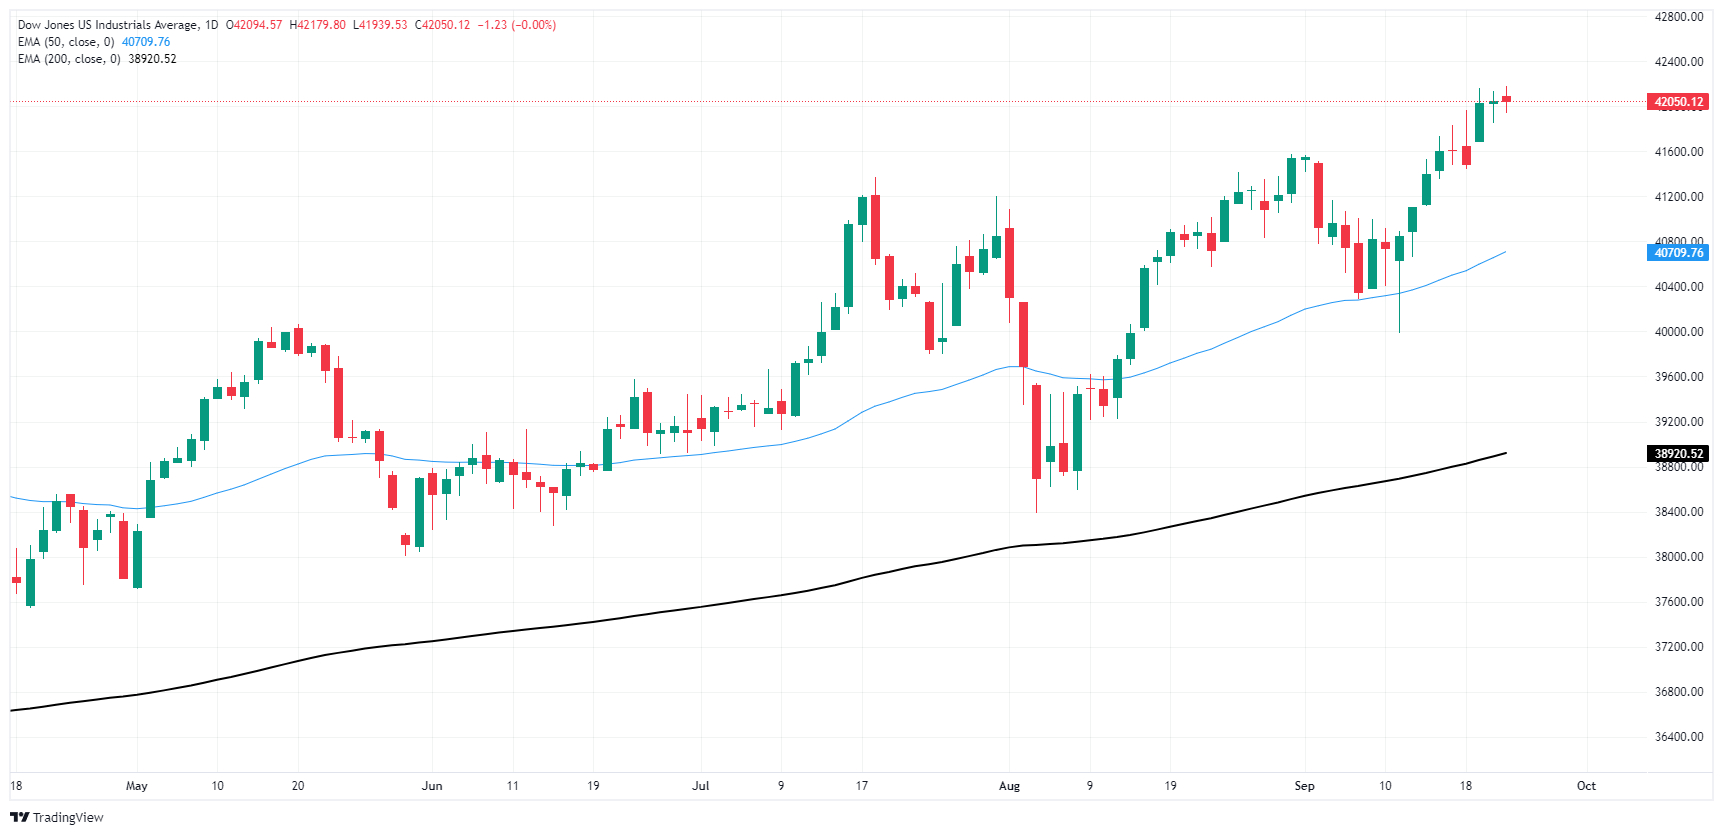
The Dow Jones continues to grind out chart paper near the 42,000 price handle despite a series of brief tests into all-time highs. The DJIA has rallied nearly 5.5% from the last swing low below 40,000 bottom-to-top, but near-term bullish momentum appears to be straining at the outer limits.
With bulls running out of technical levels to act as hard targets, the Dow Jones could be primed for a half-hearted bearish pullback with an immediate technical floor priced in near the 50-day Exponential Moving Average (EMA) rising from 40,700.
Dow Jones daily chart
Fed FAQs
Monetary policy in the US is shaped by the Federal Reserve (Fed). The Fed has two mandates: to achieve price stability and foster full employment. Its primary tool to achieve these goals is by adjusting interest rates. When prices are rising too quickly and inflation is above the Fed’s 2% target, it raises interest rates, increasing borrowing costs throughout the economy. This results in a stronger US Dollar (USD) as it makes the US a more attractive place for international investors to park their money. When inflation falls below 2% or the Unemployment Rate is too high, the Fed may lower interest rates to encourage borrowing, which weighs on the Greenback.
The Federal Reserve (Fed) holds eight policy meetings a year, where the Federal Open Market Committee (FOMC) assesses economic conditions and makes monetary policy decisions. The FOMC is attended by twelve Fed officials – the seven members of the Board of Governors, the president of the Federal Reserve Bank of New York, and four of the remaining eleven regional Reserve Bank presidents, who serve one-year terms on a rotating basis.
In extreme situations, the Federal Reserve may resort to a policy named Quantitative Easing (QE). QE is the process by which the Fed substantially increases the flow of credit in a stuck financial system. It is a non-standard policy measure used during crises or when inflation is extremely low. It was the Fed’s weapon of choice during the Great Financial Crisis in 2008. It involves the Fed printing more Dollars and using them to buy high grade bonds from financial institutions. QE usually weakens the US Dollar.
Quantitative tightening (QT) is the reverse process of QE, whereby the Federal Reserve stops buying bonds from financial institutions and does not reinvest the principal from the bonds it holds maturing, to purchase new bonds. It is usually positive for the value of the US Dollar.
Author

Joshua Gibson
FXStreet
Joshua joins the FXStreet team as an Economics and Finance double major from Vancouver Island University with twelve years' experience as an independent trader focusing on technical analysis.


