Dow Jones Industrial Average recovers balance but gains remain muted on Monday
- Dow Jones climbed around one hundred points amid tepid Monday markets.
- Broad-market hopes for a Fed rate cut have run into the ceiling.
- Key US activity and inflation data looms ahead later in the week.

The Dow Jones Industrial Average (DJIA) climbed around one hundred points on Monday in a thin recovery from last week’s late pullback. Equities are drifting into the high end, but the Dow Jones is holding steady as investors gear up for a fresh round of key US data due later in the week.
According to the CME’s FedWatch Tool, rate markets are still pricing in an all-but-certain rate cut from the Federal Reserve (Fed) in September. Rate traders are pricing in 95% odds of at least a quarter-point rate trim when the Federal Open Market Committee (FOMC) meets on September 18.
A fresh round of S&P Global Manufacturing and Services Purchasing Managers Index (PMI) figures are due on Wednesday, followed by a Gross Domestic Product print on Thursday. Friday will wrap up the trading week with an update to the Personal Consumption Expenditure - Price Index (PCE) inflation figures.
Market participants looking for a Fed rate cut will be hoping for easing figures, and Wednesday’s Services PMI for July is expected to ease to 54.4 from 55.3. Annualized Q2 US GDP is expected to accelerate to 1.9% from 1.4%, and Friday’s PCE Price Index inflation for June is broadly expected to tick higher on the near end of the curve, forecast to print at 0.1% MoM versus the previous 0.0% print.
Dow Jones news
About a third of the Dow Jones is in the red on Monday, with concentrated losses in major names keeping prices more subdued across the wider index. Verizon Communications Inc. (VZ) reported a miss against quarterly revenue estimates, falling roughly 6% to $39.09 per share. On the high side, Nike Inc. (NKE) recovered ground on Monday, climbing nearly 3% to $74.86 per share.
Dow Jones technical outlook
The Dow Jones is cycling familiar levels on Monday, but leaning into the bullish side. Intraday price action is crimped below 40,500.00, while a near-term floor is priced in near 40,200.00. Despite a rapid pullback from record highs last week, the Dow Jones is still trading firmly north of the 200-day Exponential Moving Average (EMA) at 37,893.31, and it won’t take much of a push for a fresh round of bidding to test into new record prices near 41,500.00.
Dow Jones five minute chart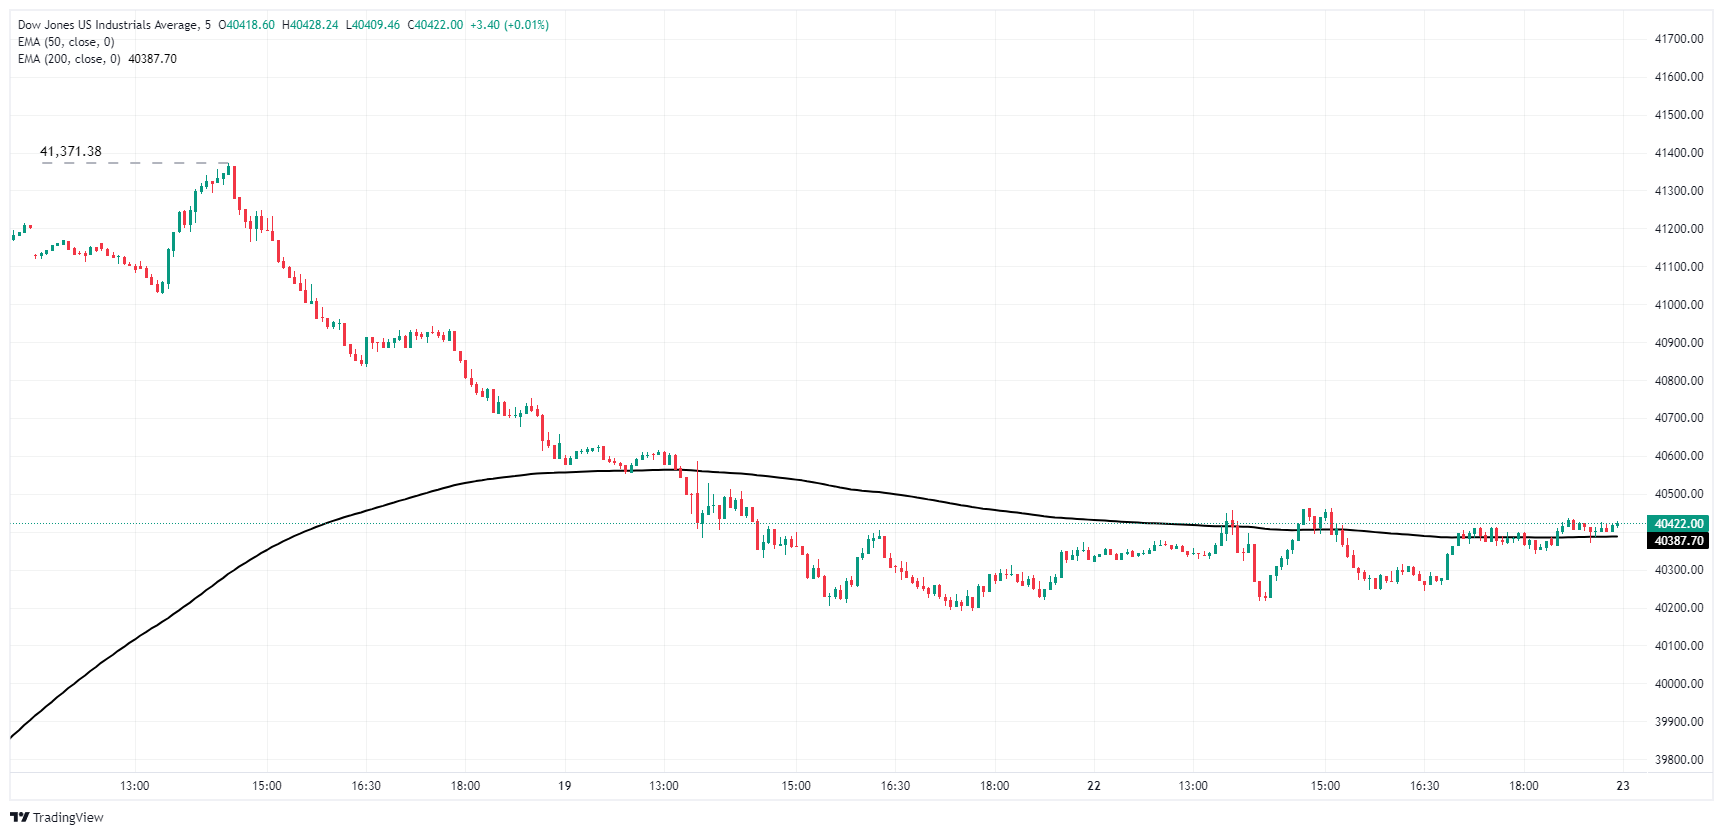
Dow Jones daily chart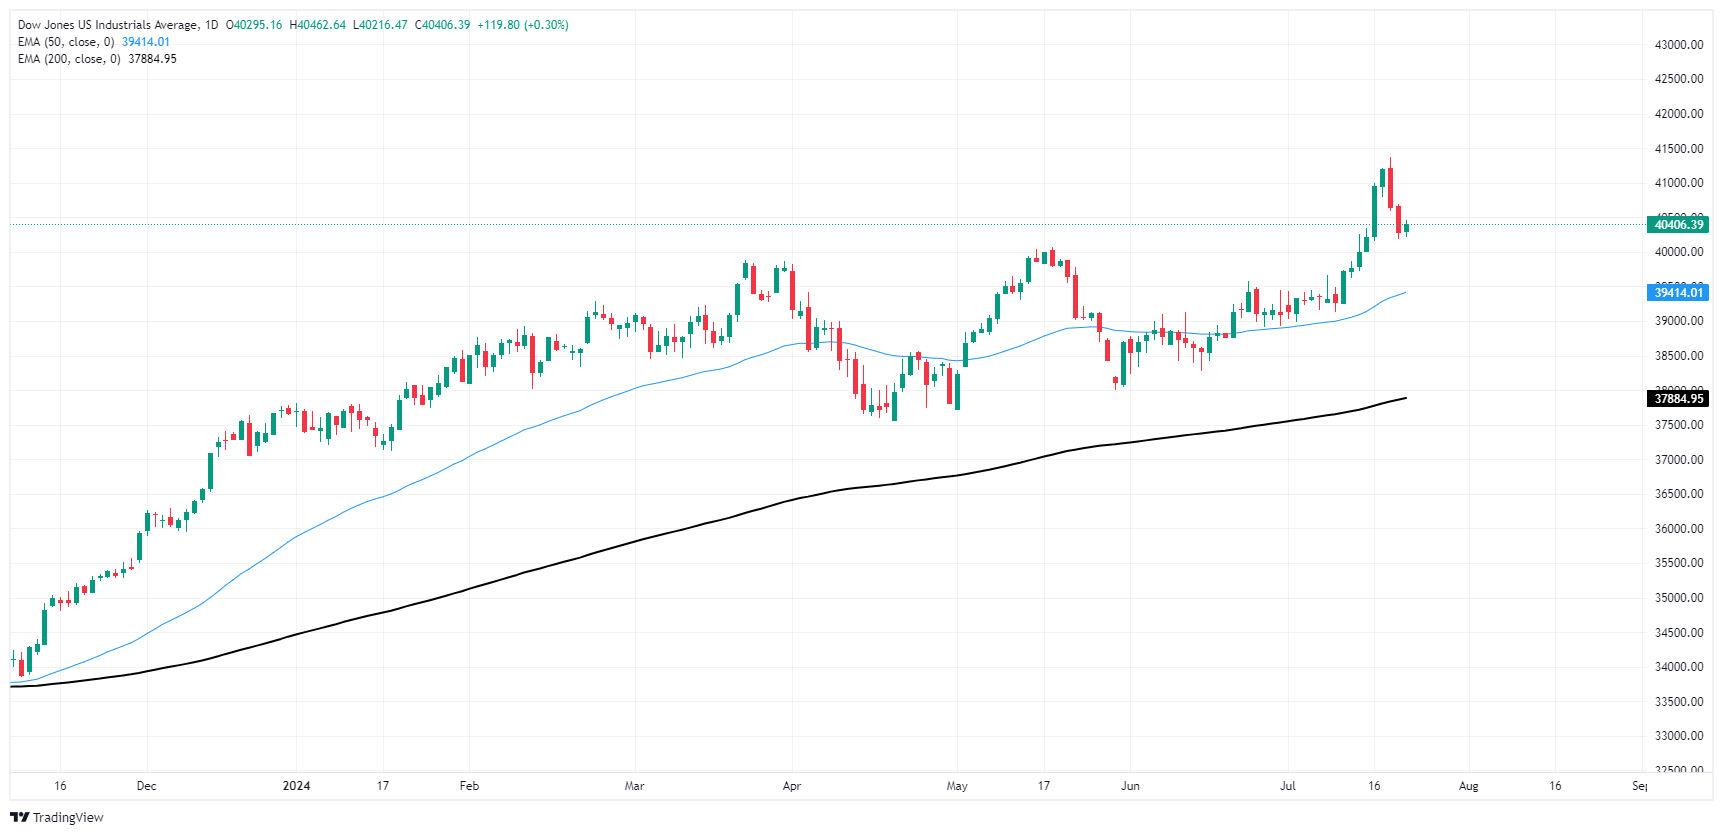
Dow Jones FAQs
The Dow Jones Industrial Average, one of the oldest stock market indices in the world, is compiled of the 30 most traded stocks in the US. The index is price-weighted rather than weighted by capitalization. It is calculated by summing the prices of the constituent stocks and dividing them by a factor, currently 0.152. The index was founded by Charles Dow, who also founded the Wall Street Journal. In later years it has been criticized for not being broadly representative enough because it only tracks 30 conglomerates, unlike broader indices such as the S&P 500.
Many different factors drive the Dow Jones Industrial Average (DJIA). The aggregate performance of the component companies revealed in quarterly company earnings reports is the main one. US and global macroeconomic data also contributes as it impacts on investor sentiment. The level of interest rates, set by the Federal Reserve (Fed), also influences the DJIA as it affects the cost of credit, on which many corporations are heavily reliant. Therefore, inflation can be a major driver as well as other metrics which impact the Fed decisions.
Dow Theory is a method for identifying the primary trend of the stock market developed by Charles Dow. A key step is to compare the direction of the Dow Jones Industrial Average (DJIA) and the Dow Jones Transportation Average (DJTA) and only follow trends where both are moving in the same direction. Volume is a confirmatory criteria. The theory uses elements of peak and trough analysis. Dow’s theory posits three trend phases: accumulation, when smart money starts buying or selling; public participation, when the wider public joins in; and distribution, when the smart money exits.
There are a number of ways to trade the DJIA. One is to use ETFs which allow investors to trade the DJIA as a single security, rather than having to buy shares in all 30 constituent companies. A leading example is the SPDR Dow Jones Industrial Average ETF (DIA). DJIA futures contracts enable traders to speculate on the future value of the index and Options provide the right, but not the obligation, to buy or sell the index at a predetermined price in the future. Mutual funds enable investors to buy a share of a diversified portfolio of DJIA stocks thus providing exposure to the overall index.
Author

Joshua Gibson
FXStreet
Joshua joins the FXStreet team as an Economics and Finance double major from Vancouver Island University with twelve years' experience as an independent trader focusing on technical analysis.


