Dow Jones Industrial Average backslides after NFP beat sours rate cut hopes
- The Dow Jones tumbled 700 points on Friday after NFP figures surged in December.
- Market bets for Fed rate cuts sank, rate traders now expect a single rate cut this year.
- Consumer sentiment and inflation expectations also rose, further hitting risk appetite.

The Dow Jones Industrial Average (DJIA) took a hard hit on Friday after investor sentiment soured on the back of a lofty Nonfarm Payrolls (NFP) jobs report, which showed a far higher rate of hiring than most investors anticipated. University of Michigan (UoM) consumer survey results also showed the average US spender expects more inflation rather than less over the next five years, further dampening risk appetite in equities as both strong jobs growth and high consumer inflation expectations bode poorly for more Federal Reserve (Fed) rate cuts.
US NFP net job additions in December rose to 256K, well above the expected 160K, while November’s print saw a slight downside revision to 212K. The UoM Consumer Sentiment Index fell to 73.2 in January, down from the previous month’s 74.0 and a steeper downturn than the expected 73.8. UoM 5-Year Consumer Inflation Expectations also rose to 3.3%, a notable step up from the previous print of 3.0%.
Markets are broadly pivoting out of Fed rate cut expectations in 2025 and dumping equities as traders pile into the safe-haven Greenback. Major institutions like Bank of America (BAC) and Goldman Sachs (GS) are pushing out post-NFP research notes that broadly admit everybody now expects even fewer rate cuts from the Fed in 2025 than before. According to the CME’s FedWatch Tool, this sentiment is being picked up by interest rate traders as well: rate markets are pricing in only a single 25 bps rate cut this year, and not until June at the earliest.
Dow Jones news
The Dow Jones is broadly lower on Friday with less than ten stocks able to find room in the green to wrap up the trading week. Losses were led by The Travelers Companies (TRV), which tumbled 4.3% on the day, falling into $232 per share. On its heels was Goldman Sachs, which fell 3.5% and slipped below $560 per share for the first time in almost a month.
Dow Jones price forecast
Friday’s post-NFP glut has pushed the Dow Jones within a stone’s throw of the 200-day Exponential Moving Average (EMA) near 41,160. The Dow Jones Industrial Average is poised to close below the 42,000 handle for the first time since early November, and the major equity index is down over 7% from record highs of 45,065 set in December.
The ongoing backslide in the Dow Jones will certainly spark fresh fears of an extended downturn; however, price action still remains north of the last major swing low, which was also supported by the 41,600 level. Despite a poor December performance and more of the same so far in January, the Dow Jones is coming off of a stellar bull run that saw the DJIA add nearly 20% bottom-to-top through 2024.
Dow Jones daily chart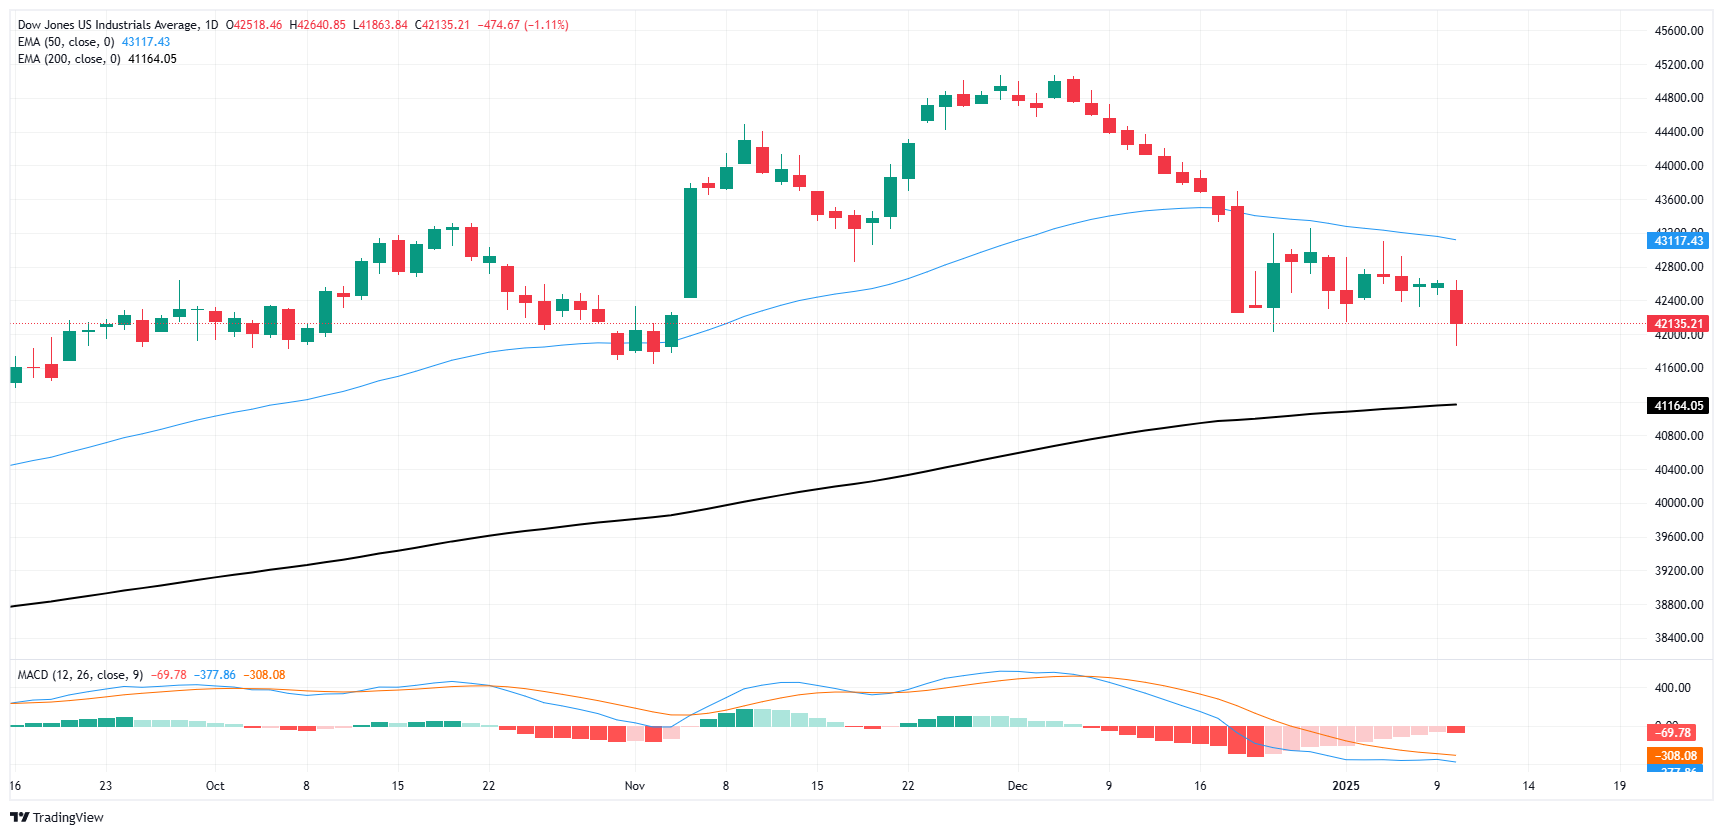
Dow Jones FAQs
The Dow Jones Industrial Average, one of the oldest stock market indices in the world, is compiled of the 30 most traded stocks in the US. The index is price-weighted rather than weighted by capitalization. It is calculated by summing the prices of the constituent stocks and dividing them by a factor, currently 0.152. The index was founded by Charles Dow, who also founded the Wall Street Journal. In later years it has been criticized for not being broadly representative enough because it only tracks 30 conglomerates, unlike broader indices such as the S&P 500.
Many different factors drive the Dow Jones Industrial Average (DJIA). The aggregate performance of the component companies revealed in quarterly company earnings reports is the main one. US and global macroeconomic data also contributes as it impacts on investor sentiment. The level of interest rates, set by the Federal Reserve (Fed), also influences the DJIA as it affects the cost of credit, on which many corporations are heavily reliant. Therefore, inflation can be a major driver as well as other metrics which impact the Fed decisions.
Dow Theory is a method for identifying the primary trend of the stock market developed by Charles Dow. A key step is to compare the direction of the Dow Jones Industrial Average (DJIA) and the Dow Jones Transportation Average (DJTA) and only follow trends where both are moving in the same direction. Volume is a confirmatory criteria. The theory uses elements of peak and trough analysis. Dow’s theory posits three trend phases: accumulation, when smart money starts buying or selling; public participation, when the wider public joins in; and distribution, when the smart money exits.
There are a number of ways to trade the DJIA. One is to use ETFs which allow investors to trade the DJIA as a single security, rather than having to buy shares in all 30 constituent companies. A leading example is the SPDR Dow Jones Industrial Average ETF (DIA). DJIA futures contracts enable traders to speculate on the future value of the index and Options provide the right, but not the obligation, to buy or sell the index at a predetermined price in the future. Mutual funds enable investors to buy a share of a diversified portfolio of DJIA stocks thus providing exposure to the overall index.
Author

Joshua Gibson
FXStreet
Joshua joins the FXStreet team as an Economics and Finance double major from Vancouver Island University with twelve years' experience as an independent trader focusing on technical analysis.


