Dow Jones Industrial Average drops further in a risk-off session

- Dow Jones extends its reversal as doubts about a June rate cut increase boost Treasury yields.
- US Factory Orders and JOLTS Job openings endorse the “no-landing” scenario for US the economy.
- The health sector is leading losses as Medicare rates have disappointed investors.
The main Wall Street indexes are going down for the second consecutive day on Tuesday. The Dow Jones Industrial Average (DJIA) is leading following strong US Factory Orders and JOLTS Jobs Opening data.
Orders for products manufactured in the US have increased 1.4% in February, following a 3.8% decline and beating expectations of a 1% increase. Beyond that, Job Openings have increased from 8.748 million to 8.756 million, above the 8.74 million expected by the markets.
The recent US data confirms the strong US economic outlook and a tight labor market, far from the ideal scenario to start lowering borrowing costs. Cleveland Fed President Loreta Mester assured on Tuesday that she expects rate cuts this year, but she did not specify any timing. This has sent US yields and the US Dollar higher with equities bleeding as investors dial back their hopes for a June rate cut.
Dow Jones news
The Dow Jones Index declines 1.20% to 39,094 on Tuesday’s morning trade. The Health sector is leading losses with a 1.98% decline following reports that the Biden administration has failed to increase Medicare rates to the extent investors would have hoped.
The Consumer Discretionary sector drops 1.62%. Only the Energy and Utilities sectors are trading above opening levels with increases of 0.53% and 0.24%, respectively.
United Health Group (UNH) is the biggest loser on Tuesday with a 8% sell-off to $450.35. Next is Intel (INTC), trading 2.06% below opening levels to $43.60.
On the positive side, Dow Inc (DOW) advances 0.84% to $58.70 with Verizon Communications (VZ) up 0.1% to $42.35.
Dow Jones technical outlook
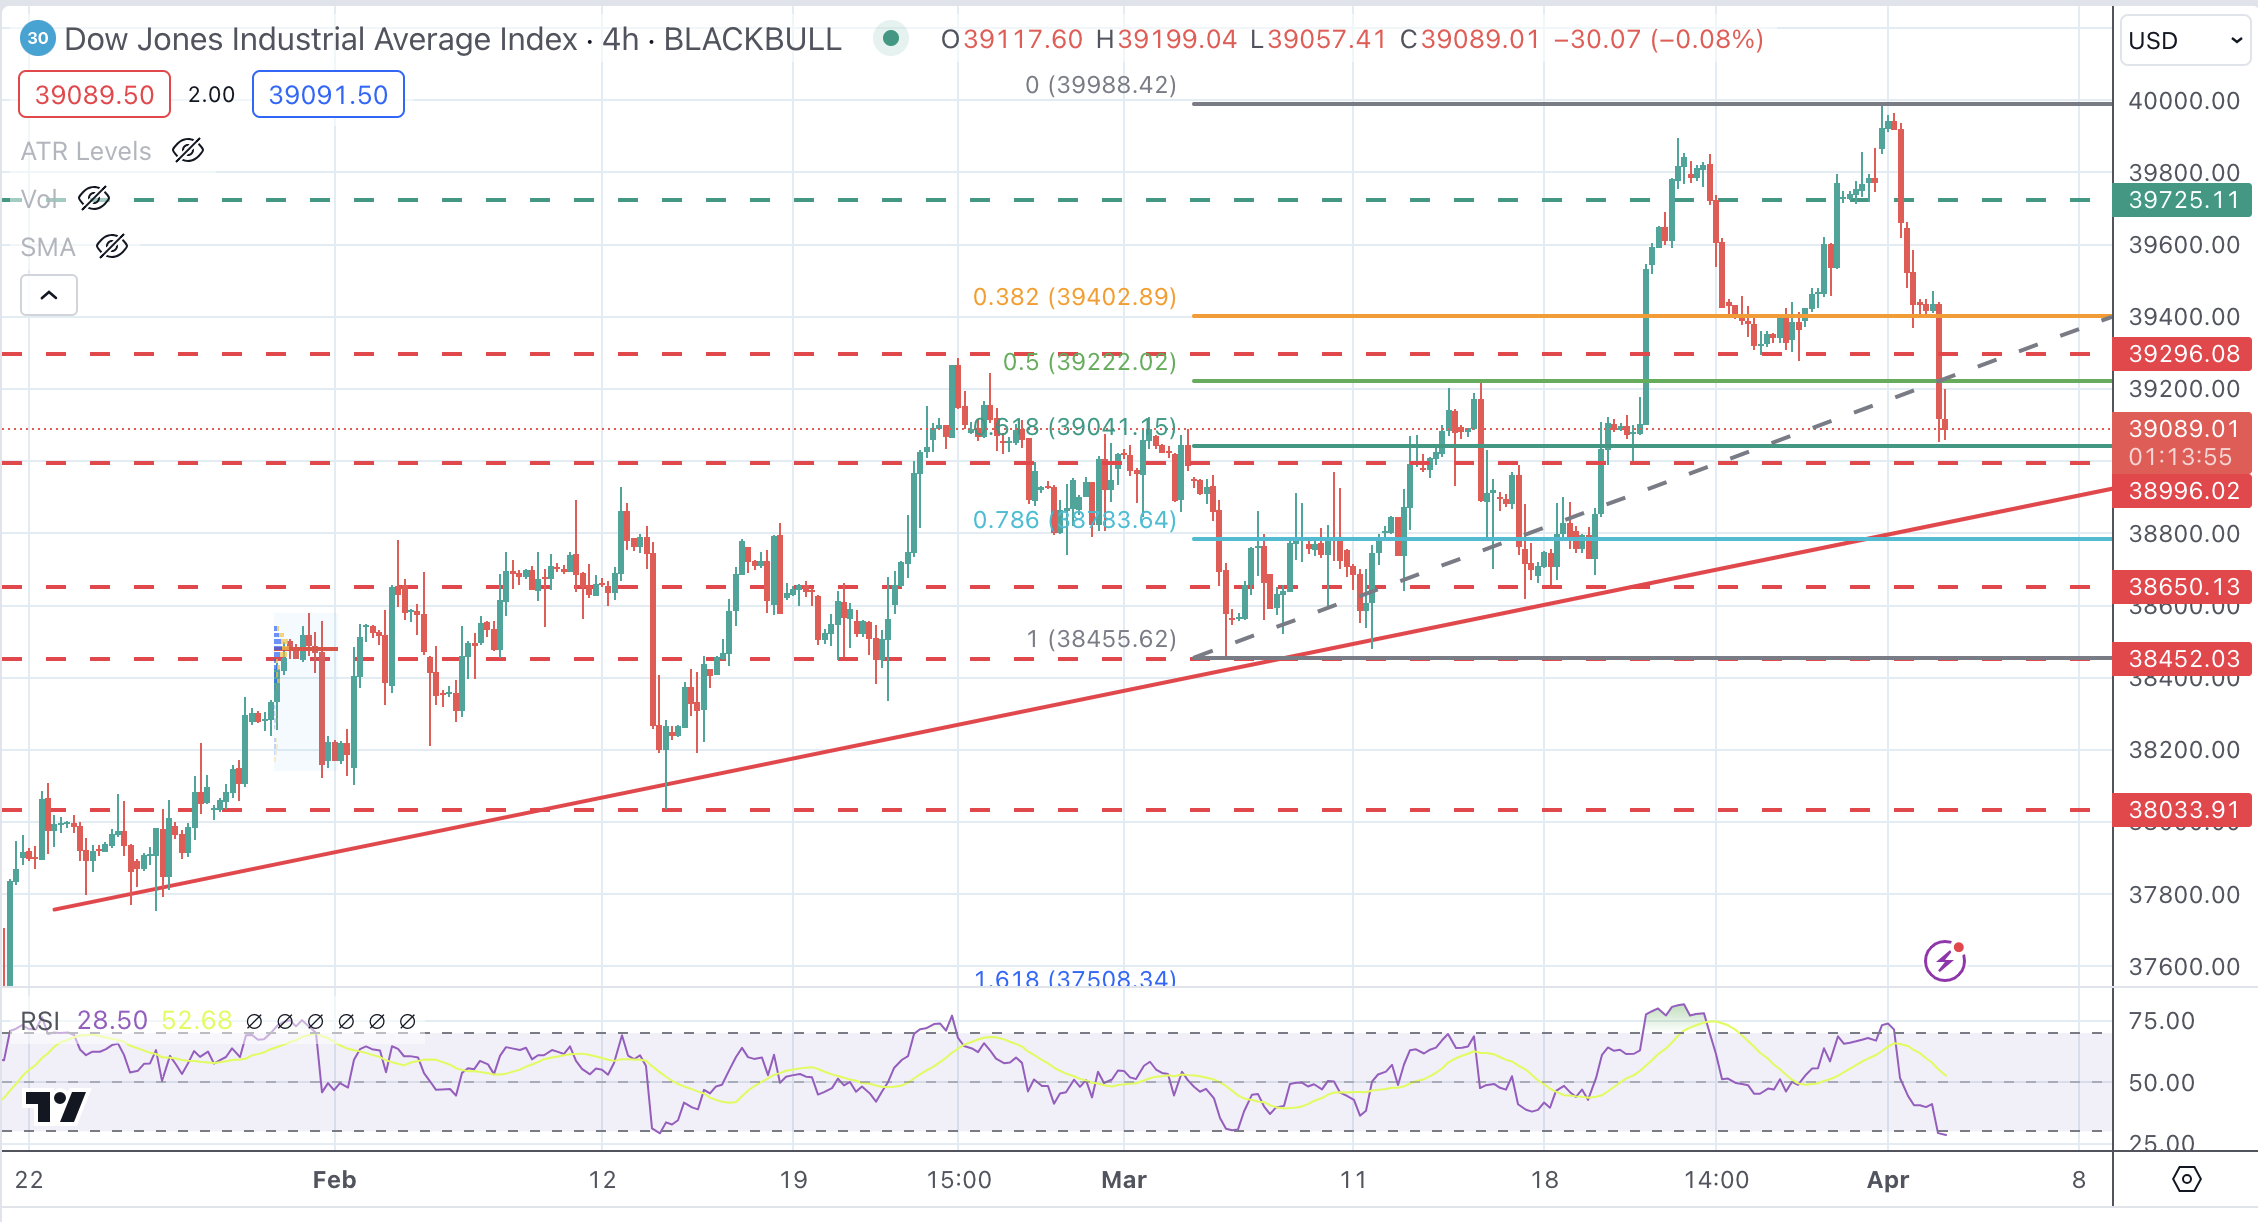
The technical picture shows the Dow Jones Index correcting lower with the broader bullish trend still intact. Price Action has broken the 50% Fibonacci retracement of the March rally, at 39,300, and is heading to the 39,000 support area. Further down, trendline support is at 38,835.
On the upside, the mentioned support at 39,300 might act as a resistance now and close the path toward the key area at 40,000.
DJIA 4-Hour Chart
Dow Jones FAQs
The Dow Jones Industrial Average, one of the oldest stock market indices in the world, is compiled of the 30 most traded stocks in the US. The index is price-weighted rather than weighted by capitalization. It is calculated by summing the prices of the constituent stocks and dividing them by a factor, currently 0.152. The index was founded by Charles Dow, who also founded the Wall Street Journal. In later years it has been criticized for not being broadly representative enough because it only tracks 30 conglomerates, unlike broader indices such as the S&P 500.
Many different factors drive the Dow Jones Industrial Average (DJIA). The aggregate performance of the component companies revealed in quarterly company earnings reports is the main one. US and global macroeconomic data also contributes as it impacts on investor sentiment. The level of interest rates, set by the Federal Reserve (Fed), also influences the DJIA as it affects the cost of credit, on which many corporations are heavily reliant. Therefore, inflation can be a major driver as well as other metrics which impact the Fed decisions.
Dow Theory is a method for identifying the primary trend of the stock market developed by Charles Dow. A key step is to compare the direction of the Dow Jones Industrial Average (DJIA) and the Dow Jones Transportation Average (DJTA) and only follow trends where both are moving in the same direction. Volume is a confirmatory criteria. The theory uses elements of peak and trough analysis. Dow’s theory posits three trend phases: accumulation, when smart money starts buying or selling; public participation, when the wider public joins in; and distribution, when the smart money exits.
There are a number of ways to trade the DJIA. One is to use ETFs which allow investors to trade the DJIA as a single security, rather than having to buy shares in all 30 constituent companies. A leading example is the SPDR Dow Jones Industrial Average ETF (DIA). DJIA futures contracts enable traders to speculate on the future value of the index and Options provide the right, but not the obligation, to buy or sell the index at a predetermined price in the future. Mutual funds enable investors to buy a share of a diversified portfolio of DJIA stocks thus providing exposure to the overall index.
Author

Guillermo Alcala
FXStreet
Graduated in Communication Sciences at the Universidad del Pais Vasco and Universiteit van Amsterdam, Guillermo has been working as financial news editor and copywriter in diverse Forex-related firms, like FXStreet and Kantox.


