Dow Jones Industrial Average tumbles 500 points on fear-driven Thursday
- Dow Jones tumbled after a misfire in US PMI activity figures on Thursday.
- Concerns of a steepening economic downturn crimped risk appetite.
- Markets struggling to balance hope for rate cuts with economic realities.

The Dow Jones Industrial Average (DJIA) tumbled 500 points on Thursday after worsening economic activity figures reminded markets of the very real risk that a downturn in the US economy could tip into a hard landing scenario. Near-term gains sparked by rising hopes for interest rate cuts were wiped out as investors struggle to balance their hopes for soft data to spark a new rate cutting cycle from the Federal Reserve (Fed) and the fact that those same soft figures could spark a full-blown recession, rendering rate cuts a moot point.
US Initial Jobless Claims for the week ended July 26 rose to 249K from the previous week’s 235K, lurching past the forecast uptick to 236K. July’s US ISM Manufacturing Purchasing Managers Index (PMI) tumbled to an eight-month low of 46.8 compared to the previous 48.5 and entirely reversing the forecast move up to 48.8.
On the other side of the same coin, ISM Manufacturing Prices Paid in July accelerated to 52.9 versus the previous 52.9 compared to the forecast 48.8 as input prices for manufacturers continue to drift higher than markets anticipated even as activity declines.
Friday’s US Nonfarm Payrolls (NFP) will be a key data point for markets to wrap up the trading week. July’s NFP labor print is expected to ease to 175K from the previous 206K, and Average Hourly Earnings are expected to hold steady at 0.3% MoM.
Markets are struggling to balance on the edge of a very sharp knife as a downturn in economic figures is helping to pin rate cut expectations even further into the ceiling. According to the CME’s FedWatch Tool, rate traders are pricing in 100% odds of at least a quarter-point rate cut from the Fed on September 18, with further one-in-five odds of a double-cut for 50 basis points. On the downside, too much of a downturn will obliterate market sentiment as a hard landing economic scenario for the US economy makes any rate cuts from the Fed irrelevant, and investors are strung along a difficult middle ground where they hope for rate cuts on soft data, but not so soft that the US economy rolls over.
Dow Jones news
Over two-thirds of the securities listed on the Dow Jones equity index fell into the red on Thursday as investor sentiment soured. Boeing Co. (BA) tumbled nearly -6.5% and falling below $180.00 per share on the day, extending Wednesday’s declines after the aviation company reported a net loss $1.4 billion in the second quarter. The in-turmoil plane builder is struggling to find its feet after naming a new CEO to helm the floundering company whose books are buckling under the weight of half a decade of financial losses.
Dow Jones technical outlook
The Dow Jones is struggling to find a foothold amid steep selling pressure on Thursday, falling from 41,080.00 to 40,200.00, declining -2.56% peak-to-trough from Wednesday’s late peak near 41,200.00 and shedding around 700 points from top to bottom.
Despite near-term downside pressure, the major equity index is still trading deep in bull country, holding north of the 50-day Exponential Moving Average (EMA) at 39,682.22. The Dow Jones has traded above the 200-day EMA in a no-touch extended rally since crossing above the long-term average in November of last year.
Dow Jones daily chart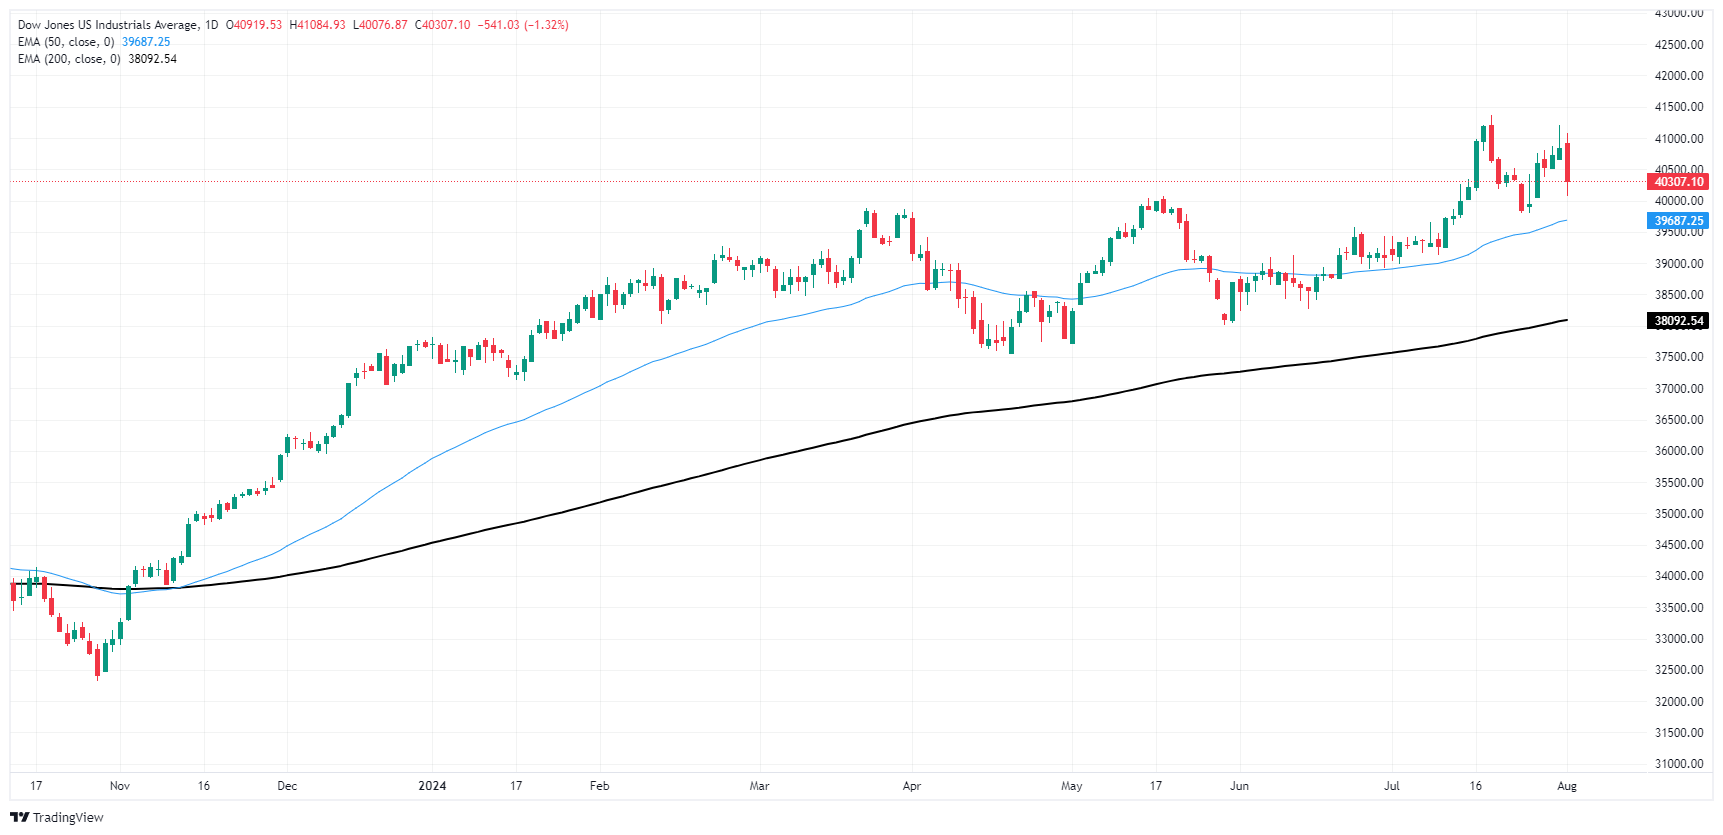
Dow Jones FAQs
The Dow Jones Industrial Average, one of the oldest stock market indices in the world, is compiled of the 30 most traded stocks in the US. The index is price-weighted rather than weighted by capitalization. It is calculated by summing the prices of the constituent stocks and dividing them by a factor, currently 0.152. The index was founded by Charles Dow, who also founded the Wall Street Journal. In later years it has been criticized for not being broadly representative enough because it only tracks 30 conglomerates, unlike broader indices such as the S&P 500.
Many different factors drive the Dow Jones Industrial Average (DJIA). The aggregate performance of the component companies revealed in quarterly company earnings reports is the main one. US and global macroeconomic data also contributes as it impacts on investor sentiment. The level of interest rates, set by the Federal Reserve (Fed), also influences the DJIA as it affects the cost of credit, on which many corporations are heavily reliant. Therefore, inflation can be a major driver as well as other metrics which impact the Fed decisions.
Dow Theory is a method for identifying the primary trend of the stock market developed by Charles Dow. A key step is to compare the direction of the Dow Jones Industrial Average (DJIA) and the Dow Jones Transportation Average (DJTA) and only follow trends where both are moving in the same direction. Volume is a confirmatory criteria. The theory uses elements of peak and trough analysis. Dow’s theory posits three trend phases: accumulation, when smart money starts buying or selling; public participation, when the wider public joins in; and distribution, when the smart money exits.
There are a number of ways to trade the DJIA. One is to use ETFs which allow investors to trade the DJIA as a single security, rather than having to buy shares in all 30 constituent companies. A leading example is the SPDR Dow Jones Industrial Average ETF (DIA). DJIA futures contracts enable traders to speculate on the future value of the index and Options provide the right, but not the obligation, to buy or sell the index at a predetermined price in the future. Mutual funds enable investors to buy a share of a diversified portfolio of DJIA stocks thus providing exposure to the overall index.
Author

Joshua Gibson
FXStreet
Joshua joins the FXStreet team as an Economics and Finance double major from Vancouver Island University with twelve years' experience as an independent trader focusing on technical analysis.


