Dow Jones Industrial Average makes a late break on Thursday
- The Dow Jones Industrial Average rose 300 points late on Thursday.
- Equities are tepid as markets digest recent developments and mixed earnings.
- US data split on Thursday, with better unemployment claims but lagging GDP growth.

The Dow Jones Industrial Average (DJIA) churned on Thursday, marking in tracks around 44,700 before staging a late-day rally and climbing nearly 300 points to retest the 45,000 handle. Equity markets are still digesting this week’s earnings reports from heavy-hitters like Microsoft (MSFT) and Tesla (TSLA), both of which missed the bottom line on fourth-quarter performance.
Along with Microsoft and Tesla, Meta Platforms (META) was the third megacap tech company to report Q4 earnings during Wednesday’s overnight session. Meta traded into a new all-time high post-earnings, while Tesla managed to shrug off misses in both earnings growth and revenue. Microsoft’s share price backslid after missing market expectations, keeping the tech sector hobbled on Thursday.
United States (US) Gross Domestic Product (GDP) grew by just 2.3% QoQ on an annualized basis in Q4, missing the median forecast of 2.6% and falling even further from the previous quarter’s 3.1%. The sharp warning shot across the bow of headline growth flummoxed equities, sparking a deer-in-the-headlights freeze from traders expecting better.
US Initial Jobless Claims for the week ended January 24 beat expectations, helping to bolster investor sentiment somewhat, but the figure is well within recent norms. Week-over-week new unemployment benefits seekers clocked in at 207K, beating the market’s expected print of 220K. The previous week showed 223K net new unemployment claimants.
Dow Jones news
Most of the Dow Jones’ listed securities are trading into the green on Thursday, though concentrated losses in the tech sector are keeping the overall index hobbled in the midrange. Nvidia lost another 3.5%, falling below $120 per share as the tech glut continues, adding to previous losses after China’s DeepSeek threw a spanner in the market’s comfortable assumption that US-based AI tech companies had the industry on lockdown. Microsoft tumbled 6% after missing earnings expectations, falling into $415 per share.
Dow Jones price forecast
The Dow Jones Industrial Average is struggling to make headway in the back half of the trading week, with intraday bids getting stuck in the mire around 44,800. Despite near-term waffling, the overall index is still tilted firmly into the bullish side, free-floating close to record highs above 45,000. The Dow Jones is up over 7.5% from its last swing low below 42,000, and has closed in the green for all but three of the last 12 consecutive trading days.
Dow Jones daily chart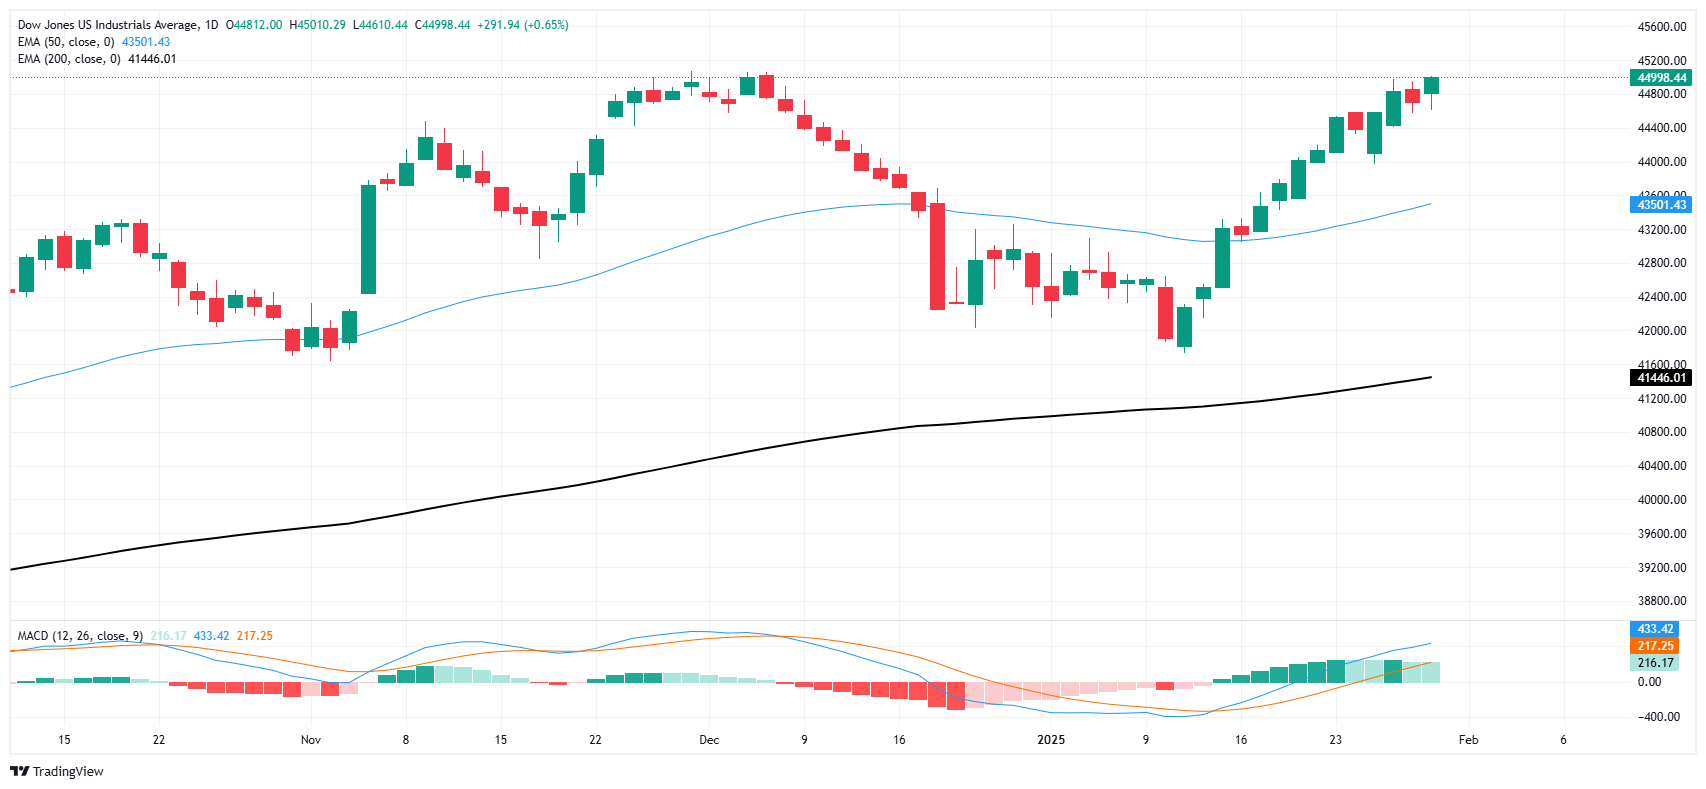
GDP FAQs
A country’s Gross Domestic Product (GDP) measures the rate of growth of its economy over a given period of time, usually a quarter. The most reliable figures are those that compare GDP to the previous quarter e.g Q2 of 2023 vs Q1 of 2023, or to the same period in the previous year, e.g Q2 of 2023 vs Q2 of 2022. Annualized quarterly GDP figures extrapolate the growth rate of the quarter as if it were constant for the rest of the year. These can be misleading, however, if temporary shocks impact growth in one quarter but are unlikely to last all year – such as happened in the first quarter of 2020 at the outbreak of the covid pandemic, when growth plummeted.
A higher GDP result is generally positive for a nation’s currency as it reflects a growing economy, which is more likely to produce goods and services that can be exported, as well as attracting higher foreign investment. By the same token, when GDP falls it is usually negative for the currency. When an economy grows people tend to spend more, which leads to inflation. The country’s central bank then has to put up interest rates to combat the inflation with the side effect of attracting more capital inflows from global investors, thus helping the local currency appreciate.
When an economy grows and GDP is rising, people tend to spend more which leads to inflation. The country’s central bank then has to put up interest rates to combat the inflation. Higher interest rates are negative for Gold because they increase the opportunity-cost of holding Gold versus placing the money in a cash deposit account. Therefore, a higher GDP growth rate is usually a bearish factor for Gold price.
Author

Joshua Gibson
FXStreet
Joshua joins the FXStreet team as an Economics and Finance double major from Vancouver Island University with twelve years' experience as an independent trader focusing on technical analysis.


