Dow Jones Industrial Average makes a late break to gain 140 points on Tuesday
- Dow Jones treads water near 38,550.00 after US data comes in mixed.
- US Factory Orders activity rises, but with steep revisions.
- First batch of labor figures comes in softer ahead of Friday’s NFP print.

The Dow Jones Industrial Average (DJIA) struggled to make gains on Tuesday after US data gave investors little reason to push the needle in either direction. The Dow Jones end the US market session up around 140 points, but investors remain tepid on bullish sentiment. US factory activity rose faster than expected in April, but previous prints saw a harsh downside revision. JOLTS April employment vacancies declined, revealing a still-tight labor market as Friday’s US Nonfarm Payrolls (NFP) looms ahead later in the week.
April’s Factory Orders rose 0.7% MoM, beating the forecast 0.6% but the previous print saw a sharp downside correction, getting revised to 0.7% from the initial print of 1.6%. JOLTS Job Openings in April fell to 8.059 million, below the forecast 8.34 million and easing from the previous 8.355 million, which was revised from 8.488 million. Looking deeper into the JOLTS figures, the labor vacancy rate fell to 4.8% from the previous 5.0%, while the number of job openings remained little-changed at 8.1 million overall. A tightening job market helped to shave some points off of Treasury yields, but the move lower in bonds did little to support equities on Tuesday.
With markets fully pricing in a first quarter-point cut from the Federal Reserve (Fed) in November, investors will be pivoting to Friday’s NFP labor figures, hoping for signs of further easing in the US economy that could push the Fed towards rate cuts sooner rather than later. Friday’s NFP print is expected to show the US economy added 190K new jobs in May, up from the previous month’s print of 175K.
Dow Jones news
The Dow Jones recovered its footing and ended Tuesday's trading with two-thirds of its constituent securities in the green after a flat start to the US market session. Dow Inc. (DOW) fell -1.64% to $55.15 per share, closely followed by JPMorgan Chase & Co. (JPM), which declined -1.32% to $199.16 per share.
Honeywell International Inc. (HON) climbed 2.36% to $207.23 per share on Tuesday. HON is slowly gaining ground after investors initially balked at Honeywell’s completion of a $4.95 billion acquisition of Carrier, a digital security firm focused on cloud-based storage protection. Investors remain skeptical that the acquisition will contribute as much to Honeywell’s diversification into digital services as the company hopes.
Dow Jones technical outlook
Dow Jones continues to grind chart paper near 38,550.00 after tumbling to near-term lows at the 38,000.00 handle. The major equity index clipped into record highs just above 40,000.00 in May, but bulls are struggling to keep bids on-balance as broader sentiment sags.
The DJIA is still trading deep into bull country, well above the 200-day Exponential Moving Average (EMA) at 37,275.22, but investors will need firmer signs of Fed rate cuts before resuming the buying party and pushing the Dow Jones back into record highs. The index is still up 2.45% in 2024, but recent short pressure has dragged the DJIA down -3.6% from all-time peaks above 40,000.00.
Dow Jones hourly chart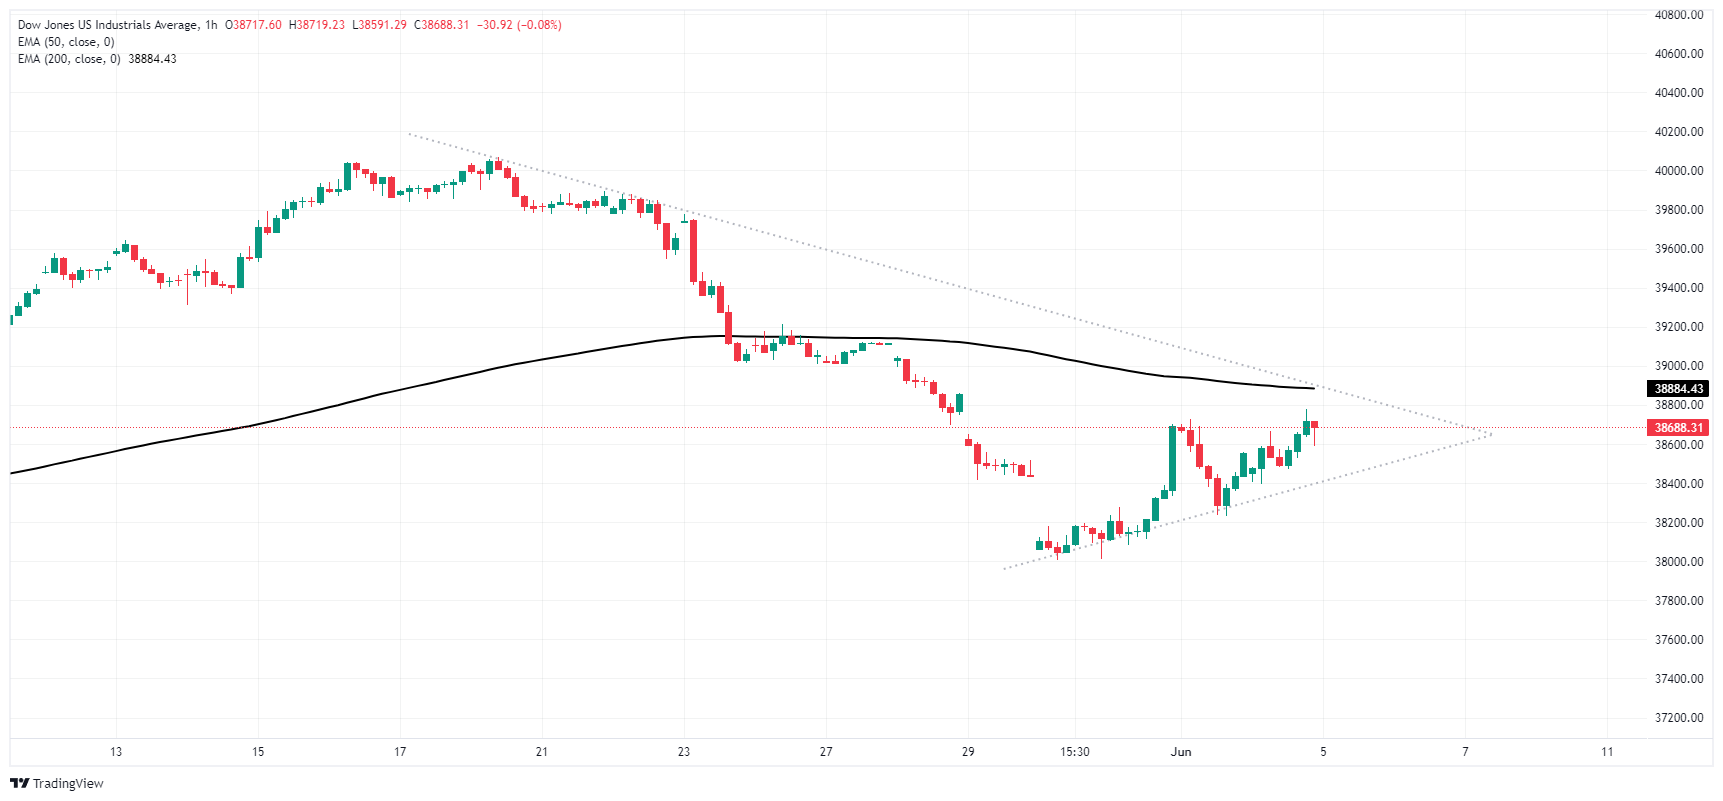
Dow Jones daily chart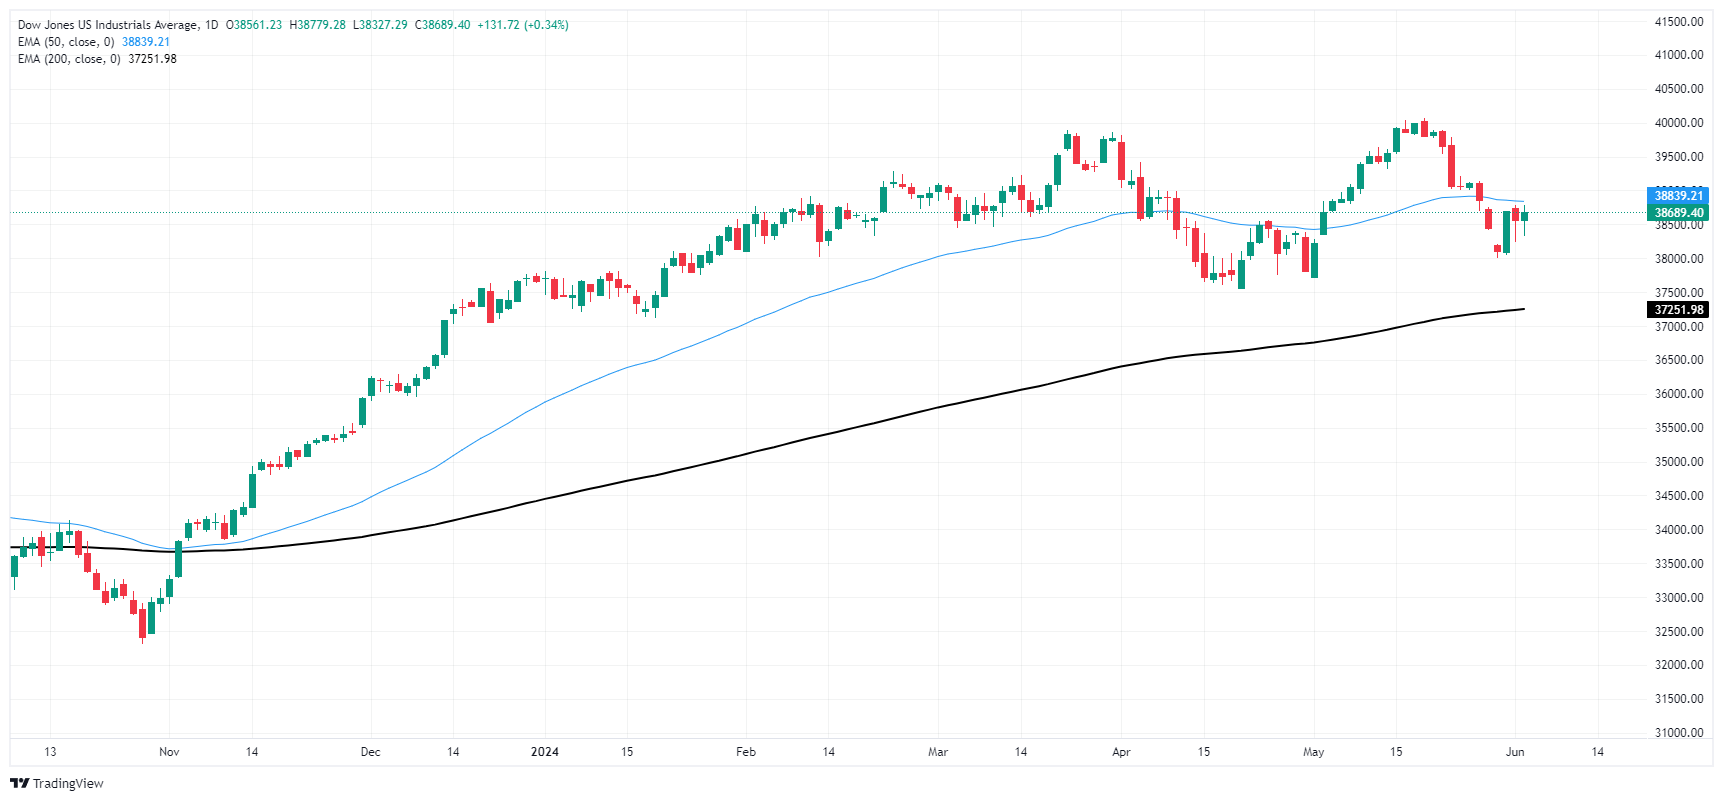
Dow Jones FAQs
The Dow Jones Industrial Average, one of the oldest stock market indices in the world, is compiled of the 30 most traded stocks in the US. The index is price-weighted rather than weighted by capitalization. It is calculated by summing the prices of the constituent stocks and dividing them by a factor, currently 0.152. The index was founded by Charles Dow, who also founded the Wall Street Journal. In later years it has been criticized for not being broadly representative enough because it only tracks 30 conglomerates, unlike broader indices such as the S&P 500.
Many different factors drive the Dow Jones Industrial Average (DJIA). The aggregate performance of the component companies revealed in quarterly company earnings reports is the main one. US and global macroeconomic data also contributes as it impacts on investor sentiment. The level of interest rates, set by the Federal Reserve (Fed), also influences the DJIA as it affects the cost of credit, on which many corporations are heavily reliant. Therefore, inflation can be a major driver as well as other metrics which impact the Fed decisions.
Dow Theory is a method for identifying the primary trend of the stock market developed by Charles Dow. A key step is to compare the direction of the Dow Jones Industrial Average (DJIA) and the Dow Jones Transportation Average (DJTA) and only follow trends where both are moving in the same direction. Volume is a confirmatory criteria. The theory uses elements of peak and trough analysis. Dow’s theory posits three trend phases: accumulation, when smart money starts buying or selling; public participation, when the wider public joins in; and distribution, when the smart money exits.
There are a number of ways to trade the DJIA. One is to use ETFs which allow investors to trade the DJIA as a single security, rather than having to buy shares in all 30 constituent companies. A leading example is the SPDR Dow Jones Industrial Average ETF (DIA). DJIA futures contracts enable traders to speculate on the future value of the index and Options provide the right, but not the obligation, to buy or sell the index at a predetermined price in the future. Mutual funds enable investors to buy a share of a diversified portfolio of DJIA stocks thus providing exposure to the overall index.
Author

Joshua Gibson
FXStreet
Joshua joins the FXStreet team as an Economics and Finance double major from Vancouver Island University with twelve years' experience as an independent trader focusing on technical analysis.


