Dow Jones Industrial Average grinds into the middle amid churning Friday markets
- Dow Jones continues to churn near 39,000.00 as markets await signs of rate cuts.
- US PCE Price Index inflation came in as-expected, easing slightly.
- Despite easing key inflation indicators, figures still remain too high for Fed.

The Dow Jones Industrial Average (DJIA) briefly rallied to 39,440.00 early Friday after US Personal Consumption Expenditure Price Index (PCE) inflation figures printed as markets broadly expected. However, risk appetite settled quickly, and equities slumped back below the day’s opening bids as investors found little has actually changed in the outlook for timing rate cuts from the Federal Reserve (Fed).
Core PCE Price Index inflation ticked down to 2.6% YoY in May, meeting median forecasts and cooling slightly from the previous 2.8%. However, figures still remain well above the Fed’s 2% annual inflation target, and the plodding progress in cooling inflation is unlikely to light a fire underneath the US central bank to begin cutting rates sooner rather than later.
According to the CME’s FedWatch Tool, rate markets are now pricing in 66% odds of at least a quarter-point rate cut from the Federal Open Market Committee (FOMC) on September 18, up slightly from the 60% odds that were priced in before the PCE Price Index inflation print.
US Personal Income rose to 0.5% MoM in May, beating the forecast increase to 0.4% from the previous 0.3%. However, Personal Spending only rose 0.2% versus the forecast 0.3%, and the previous figure saw a slight revision to 0.1% from 0.2%.
The University of Michigan (UoM) Consumer Sentiment Survey rebounded firmly to 68.2, vaulting over the forecast uptick to 65.8 from the previous 65.6. UoM 5-year Consumer Inflation Expectations also ticked lower, down to 3.0% from the previous 3.1%. Despite a slight easing in where consumers expect inflation to be in the next five years, the figure still remains higher than Fed targets.
Consumer price growth expectations continue to hold on the high end, plagued by recent memory of “transitory” inflation pressures that lasted for at least six consecutive quarters. Consumers also remain keenly aware that core inflation figures continue to ride at three-decade highs compared to the long-run average.
Dow Jones news
The Dow Jones was roughly on-balance on Friday, with about half of the index’s constituent securities in the green, though sharp losses in key stocks are dragging the index lower on the day. Salesforce Inc. (CRM) recovered from a jittery bearish pullback heading into the company’s private shareholder meeting this week. The stock is trading up 2.5% on Friday, testing $260.00 per share.
Nike Inc. (NKE) was battered badly on Friday, facing steep enough losses to drag the Dow Jones lower single-handedly. Nike revealed updated forward guidance on Friday, and the company now expects a 10% decline in revenues in the first quarter of 2025 in a reversal of previous guidance that anticipated steady growth in 2025. NKE is down over 20% on the day, trading into a multi-year low of $75.00 per share.
Dow Jones technical outlook
Despite finding a fresh high for the week on Friday, the Dow Jones continues to trade into median levels just north of the 39,000.00 handle. Intraday price action has been slowly drifting higher through the week. Still, volatility has left the index in a notably wobbly stance, and bullish runs tend to be followed immediately by short side slumps.
The Dow Jones is still trading above technical support from the 50-day Exponential Moving Average (EMA) at 38,895.76, but price action continues to middle on the low side of recent all-time highs set above the 40,000.00 major price handle.
Dow Jones five minute chart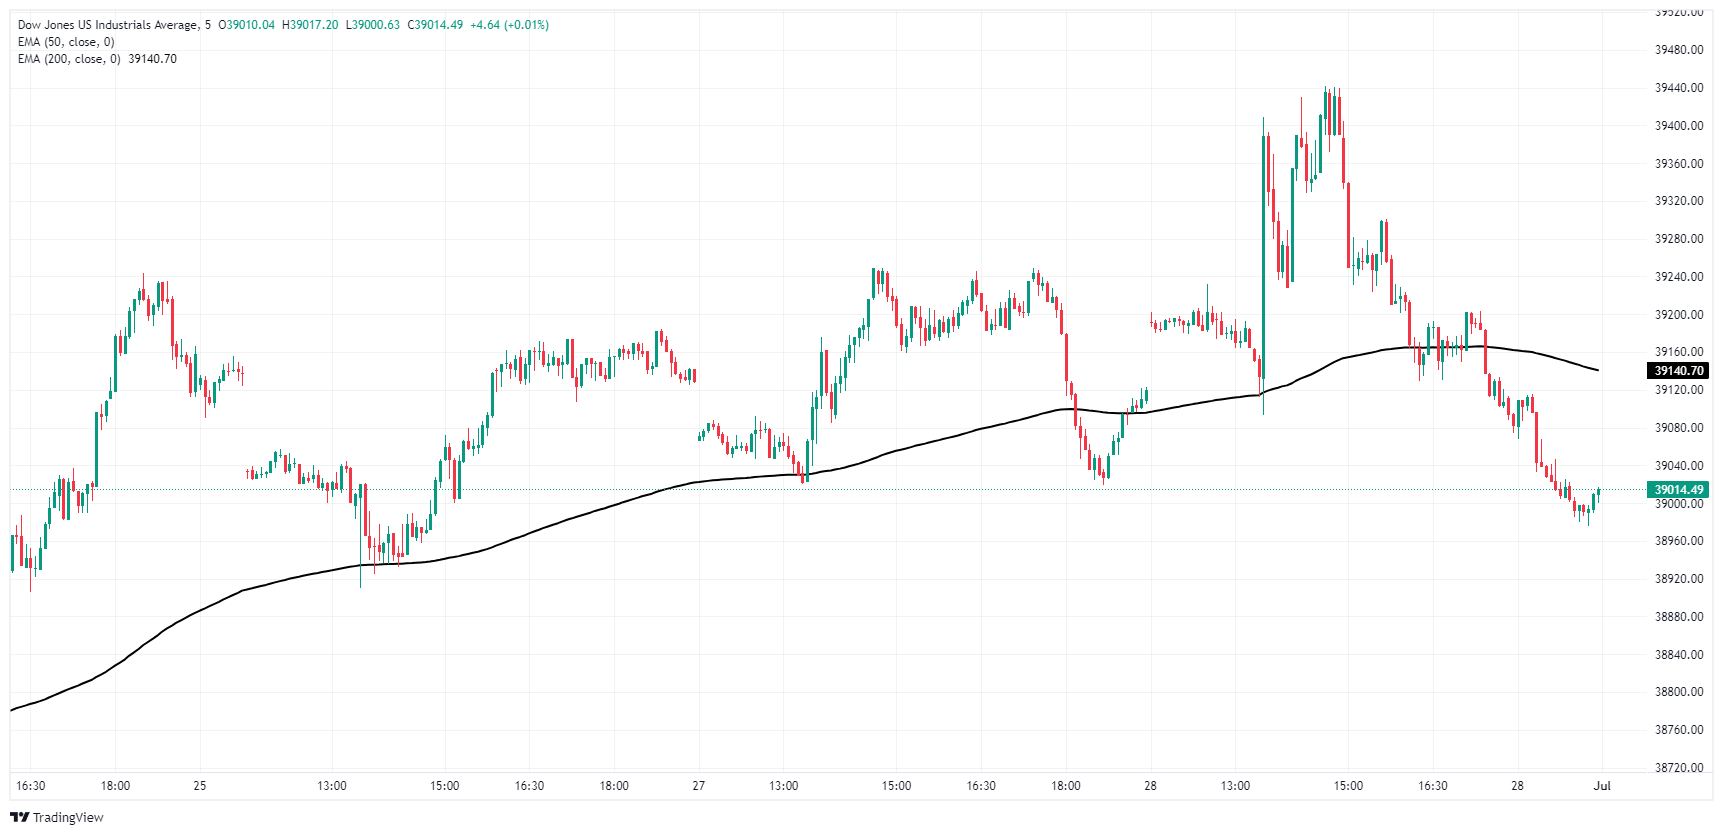
Dow Jones daily chart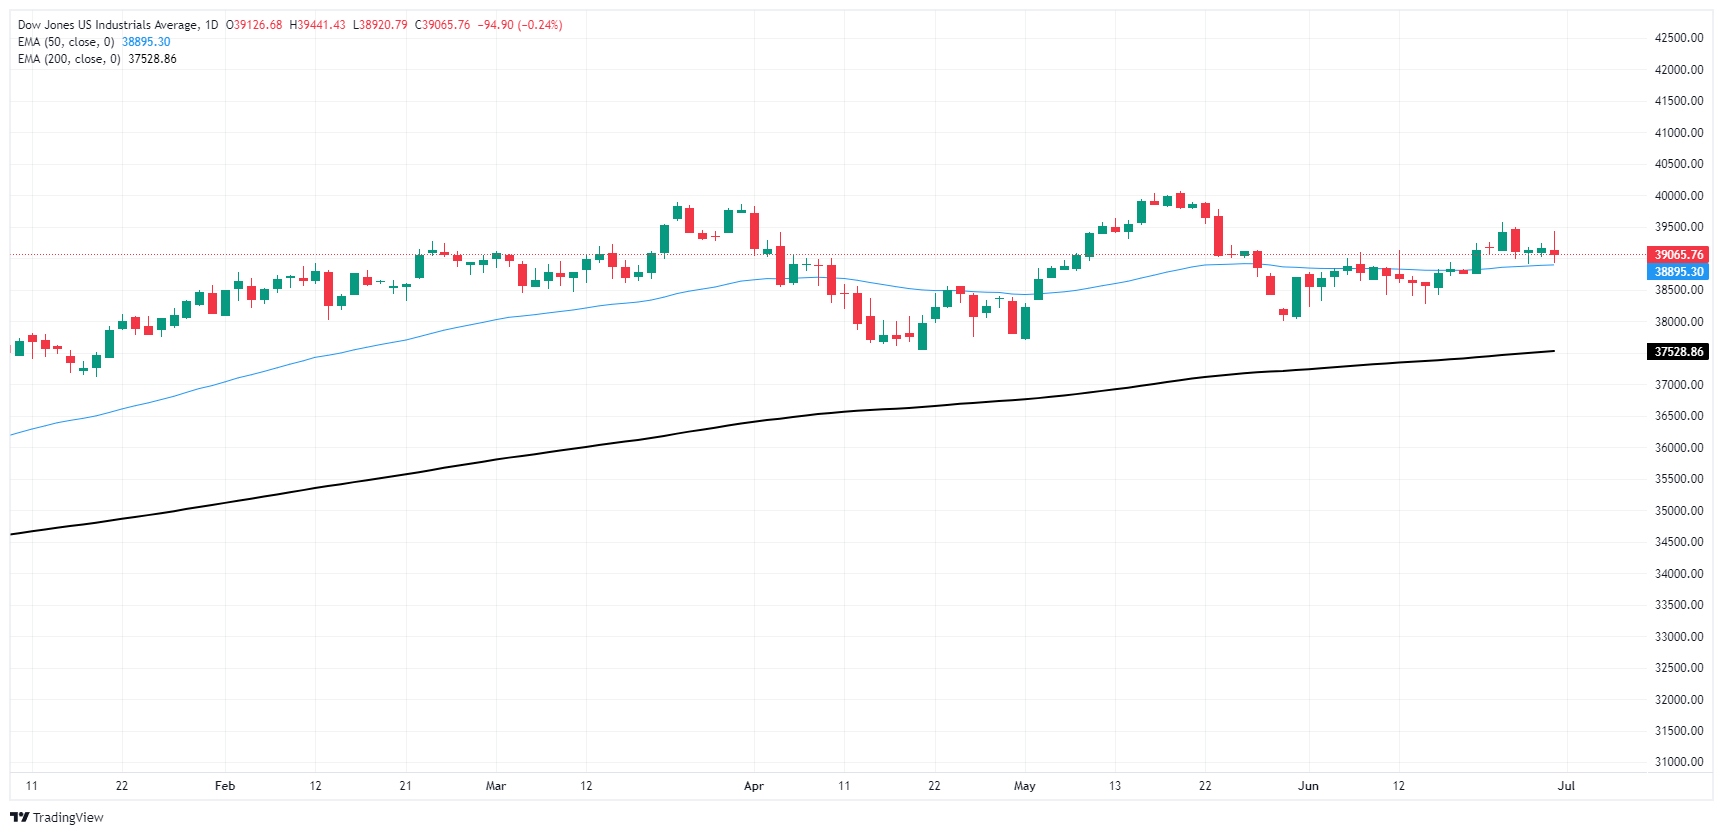
Dow Jones FAQs
The Dow Jones Industrial Average, one of the oldest stock market indices in the world, is compiled of the 30 most traded stocks in the US. The index is price-weighted rather than weighted by capitalization. It is calculated by summing the prices of the constituent stocks and dividing them by a factor, currently 0.152. The index was founded by Charles Dow, who also founded the Wall Street Journal. In later years it has been criticized for not being broadly representative enough because it only tracks 30 conglomerates, unlike broader indices such as the S&P 500.
Many different factors drive the Dow Jones Industrial Average (DJIA). The aggregate performance of the component companies revealed in quarterly company earnings reports is the main one. US and global macroeconomic data also contributes as it impacts on investor sentiment. The level of interest rates, set by the Federal Reserve (Fed), also influences the DJIA as it affects the cost of credit, on which many corporations are heavily reliant. Therefore, inflation can be a major driver as well as other metrics which impact the Fed decisions.
Dow Theory is a method for identifying the primary trend of the stock market developed by Charles Dow. A key step is to compare the direction of the Dow Jones Industrial Average (DJIA) and the Dow Jones Transportation Average (DJTA) and only follow trends where both are moving in the same direction. Volume is a confirmatory criteria. The theory uses elements of peak and trough analysis. Dow’s theory posits three trend phases: accumulation, when smart money starts buying or selling; public participation, when the wider public joins in; and distribution, when the smart money exits.
There are a number of ways to trade the DJIA. One is to use ETFs which allow investors to trade the DJIA as a single security, rather than having to buy shares in all 30 constituent companies. A leading example is the SPDR Dow Jones Industrial Average ETF (DIA). DJIA futures contracts enable traders to speculate on the future value of the index and Options provide the right, but not the obligation, to buy or sell the index at a predetermined price in the future. Mutual funds enable investors to buy a share of a diversified portfolio of DJIA stocks thus providing exposure to the overall index.
Author

Joshua Gibson
FXStreet
Joshua joins the FXStreet team as an Economics and Finance double major from Vancouver Island University with twelve years' experience as an independent trader focusing on technical analysis.


