Dow Jones Industrial Average churns as investors look ahead to midweek Fed appearance
- Dow Jones sticks close to Monday’s opening bids in thin action.
- Markets looking for a recovery after NFP Friday hangover.
- Wednesday brings US CPI update, Fed rate call and interest rate expectations.

The Dow Jones Industrial Average (DJIA) churned chart paper on Monday, paddling around 38,750.00 as investors look for a reason to recover footing after last Friday’s Nonfarm Payrolls (NFP) rout that saw broad-market rate cut hopes wither on the vine.
Investors will be buckling down for the wait to Wednesday’s latest showing from the Federal Reserve (Fed). The Fed is broadly expected to stand pat on interest rates this week, but markets will be scrambling to see the updates to the Fed’s “dot plot”, or summary of interest rate projections.
US Consumer Price Index (CPI) inflation figures are also due on Wednesday. Investors are hoping that MoM headline CPI inflation will ease to 0.1% from 0.3%, but Core CPI is forecast to hold flat at 0.3% MoM.
Dow Jones news
The DJIA was mixed on Monday, with half of its securities in the green and the other half falling back slightly. Walmart Inc. (WMT) is rising to the top of the pile, climbing 1.73% on Monday to $67.02 per share as investors lean into the retailer, confident that Walmart’s pivot into online retail and targeting higher-income individuals will increase market share.
On the low side, Apple Inc. fell nearly -2%, declining to $192.92 per share after investors were broadly unimpressed with the company's latest tech offerings showcased at the Worldwide Developers Conference. Apple's latest tech solutions are broadly hinged on zeitgeist market darlings rather than original or intuitive solutions. Apple is championing a deeper integration between ChatGPT and its onboard algorithm assistant Siri, and the tech company also unveiled satellite messaging for iOS devices soon.
Satellite messaging is broadly famous within tech circles for being incredibly power-intensive compared to traditional cellular tower connections and having incredibly spotty connectivity during inclement weather.
Dow Jones technical outlook
The Dow Jones is looking for a foothold on Monday, holding above 38,700.00 despite a lack of upwards momentum. The major index is still down from Friday’s peaks near 39,100.00, and June’s near-term bullish rebound could be coming under threat.
The Dow Jones is still steeply off of record highs above 40,000.00, but a demand zone below 38,000.00 is providing firm long-term bullish pressure, keeping the index elevated well above the 200-day Exponential Moving Average (EMA) at 37,318.74.
Dow Jones five minute chart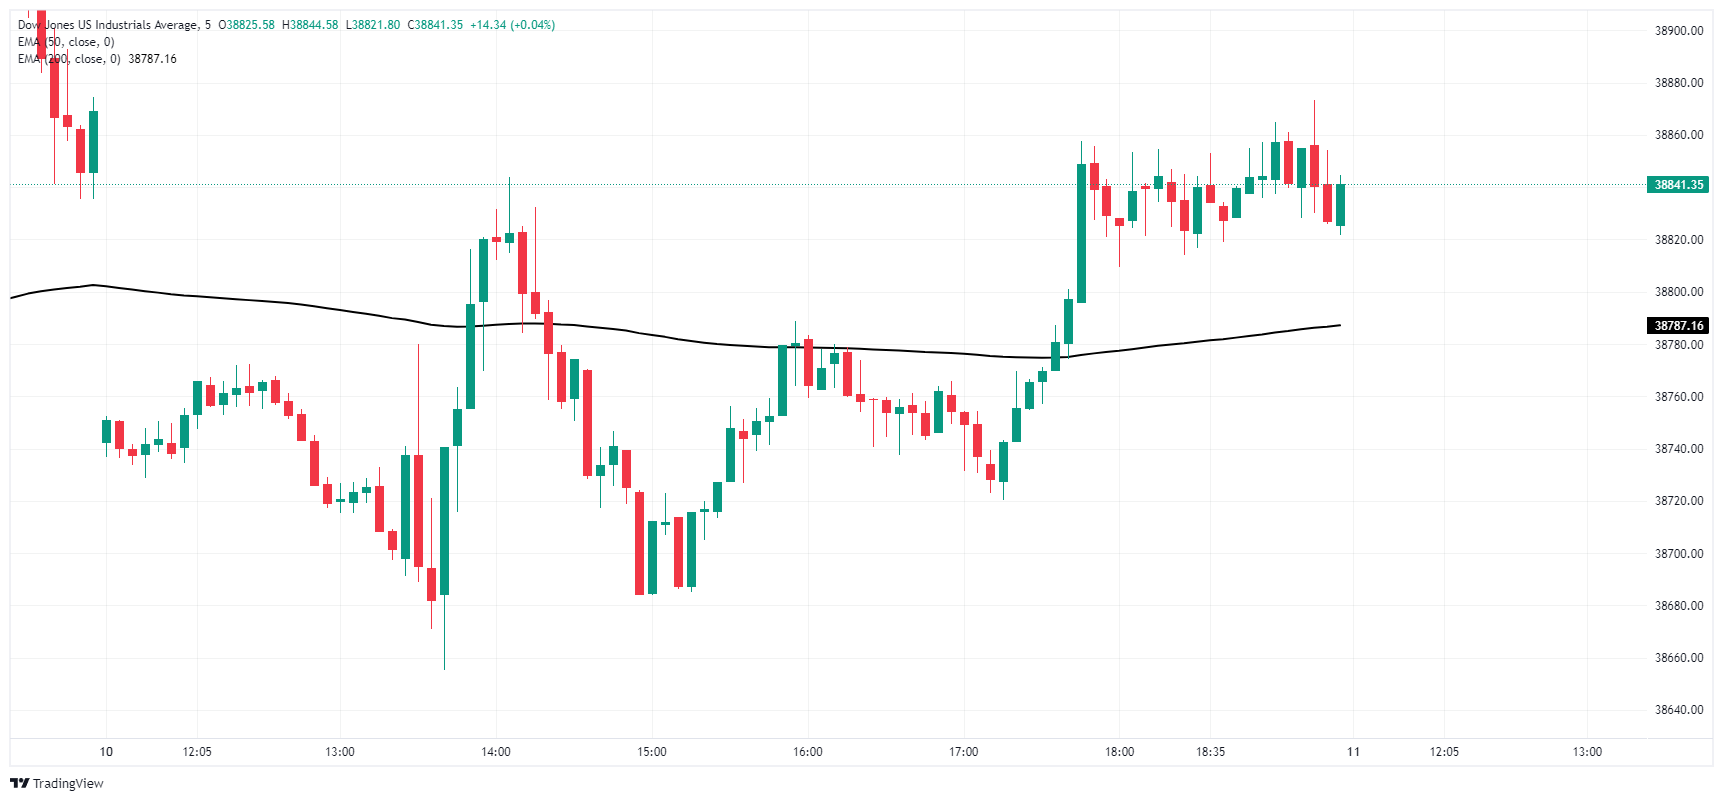
Dow Jones daily chart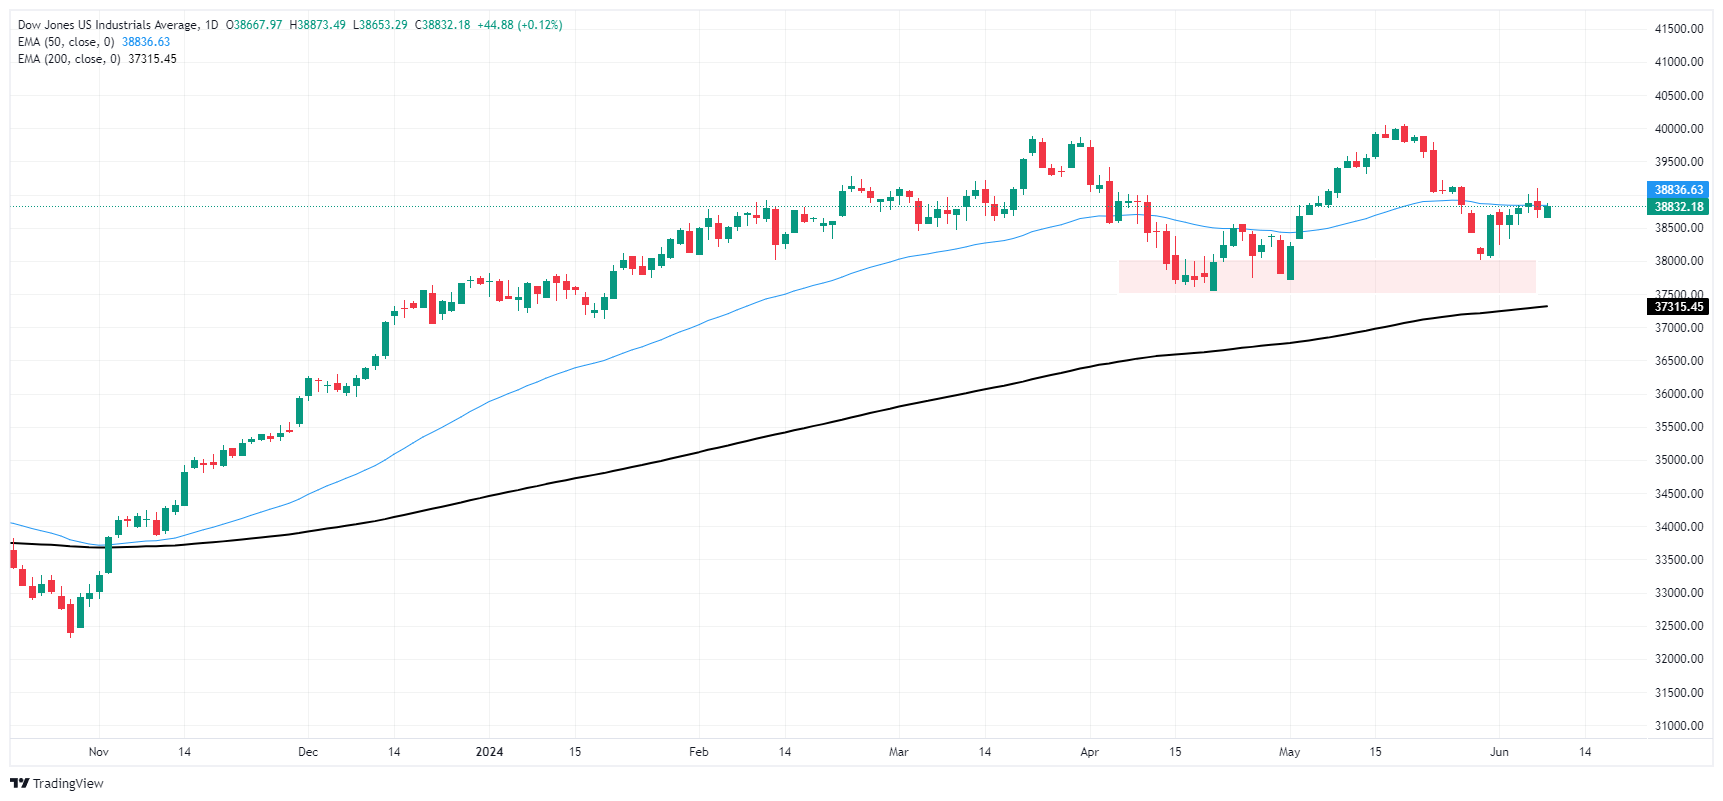
Dow Jones FAQs
The Dow Jones Industrial Average, one of the oldest stock market indices in the world, is compiled of the 30 most traded stocks in the US. The index is price-weighted rather than weighted by capitalization. It is calculated by summing the prices of the constituent stocks and dividing them by a factor, currently 0.152. The index was founded by Charles Dow, who also founded the Wall Street Journal. In later years it has been criticized for not being broadly representative enough because it only tracks 30 conglomerates, unlike broader indices such as the S&P 500.
Many different factors drive the Dow Jones Industrial Average (DJIA). The aggregate performance of the component companies revealed in quarterly company earnings reports is the main one. US and global macroeconomic data also contributes as it impacts on investor sentiment. The level of interest rates, set by the Federal Reserve (Fed), also influences the DJIA as it affects the cost of credit, on which many corporations are heavily reliant. Therefore, inflation can be a major driver as well as other metrics which impact the Fed decisions.
Dow Theory is a method for identifying the primary trend of the stock market developed by Charles Dow. A key step is to compare the direction of the Dow Jones Industrial Average (DJIA) and the Dow Jones Transportation Average (DJTA) and only follow trends where both are moving in the same direction. Volume is a confirmatory criteria. The theory uses elements of peak and trough analysis. Dow’s theory posits three trend phases: accumulation, when smart money starts buying or selling; public participation, when the wider public joins in; and distribution, when the smart money exits.
There are a number of ways to trade the DJIA. One is to use ETFs which allow investors to trade the DJIA as a single security, rather than having to buy shares in all 30 constituent companies. A leading example is the SPDR Dow Jones Industrial Average ETF (DIA). DJIA futures contracts enable traders to speculate on the future value of the index and Options provide the right, but not the obligation, to buy or sell the index at a predetermined price in the future. Mutual funds enable investors to buy a share of a diversified portfolio of DJIA stocks thus providing exposure to the overall index.
Author

Joshua Gibson
FXStreet
Joshua joins the FXStreet team as an Economics and Finance double major from Vancouver Island University with twelve years' experience as an independent trader focusing on technical analysis.


