Dow Jones Industrial Average scorches up the charts 740 points as rate cut hopes rise even higher
- Dow Jones gained 1.85% in a single day as rate cut hopes surge.
- Easing US Retail Sales data reignited market bets of a September rate cut.
- Dow Jones sets a new record high for a second day in a row.

The Dow Jones Industrial Average (DJIA) surged to a second record-setting day in a row, climbing over 740 points to chalk in a fresh all-time peak above 40,961.55 as market sentiment buries the needle even further into hopes of a September rate cut from the Federal Reserve (Fed).
US Retail Sales slumped flat in June, printing at 0.0% in-line with forecasts and falling from the previous month’s revised 0.3% uptick, signaling that the US domestic economy is continuing to soften and prompting a broad-market rush into expectations of a September rate cut.
According to the CME’s FedWatch Tool, rate markets have a September rate trim fully priced in, with functionally 100% odds of at least a quarter-point rate cut when the Federal Open Market Committee (FOMC) meets on September. The FOMC’s upcoming rate call on July 31 is still broadly expected to be a hold as policymakers wait for a few more months of data to confirm inflation is easing to targets before pulling the trigger.
Dow Jones news
The Dow Jones soared over 740 points at its highest point on Tuesday as the major equity index makes its way toward 41,000.00 after crossing the 40,000.00 major handle for the first time back in May.
Unitedhealth Group Inc. (UNH) soared 6.11% to $546.86 per share on Tuesday after it reported better-than-expected earnings in Q2, helping to send the Dow Jones further into the stratosphere. Over two-thirds of the Dow Jones is in the green for the day, though tech stocks and AI-adjacents suffered small losses as the market pivots into rate cut exposure.
Merck & Co Inc. (MRK) fell -1.84% to $125.78 per share, followed closely by Microsoft Corp. (MSFT) and Intel Corp. (INTC), falling -0.99% and -0.84%, respectively.
Dow Jones technical outlook
Buyers ran a clinic on short interest on Tuesday, sending the Dow Jones into a record intraday high for the second day in a row. Technical resistance has evaporated on the top end as the major equity index is on pace for one of its best single-day performances of 2024.
The Dow Jones has climbed over 4% and counting over the past five trading days and the index is set to challenge the 41,000.00 technical level sooner rather than later.
Dow Jones five minute chart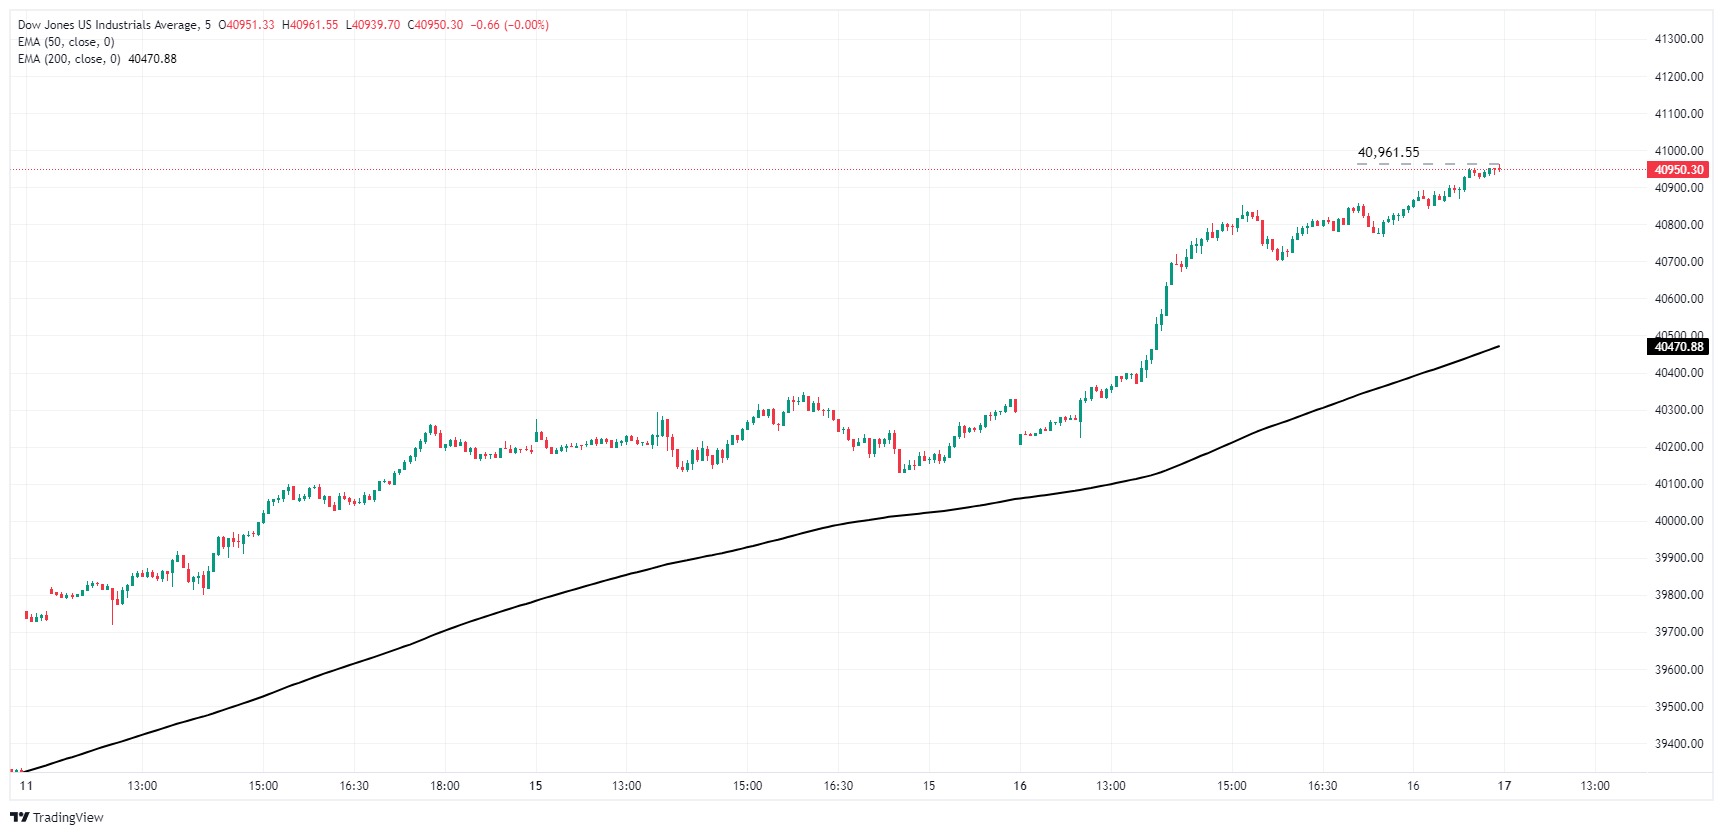
Dow Jones daily chart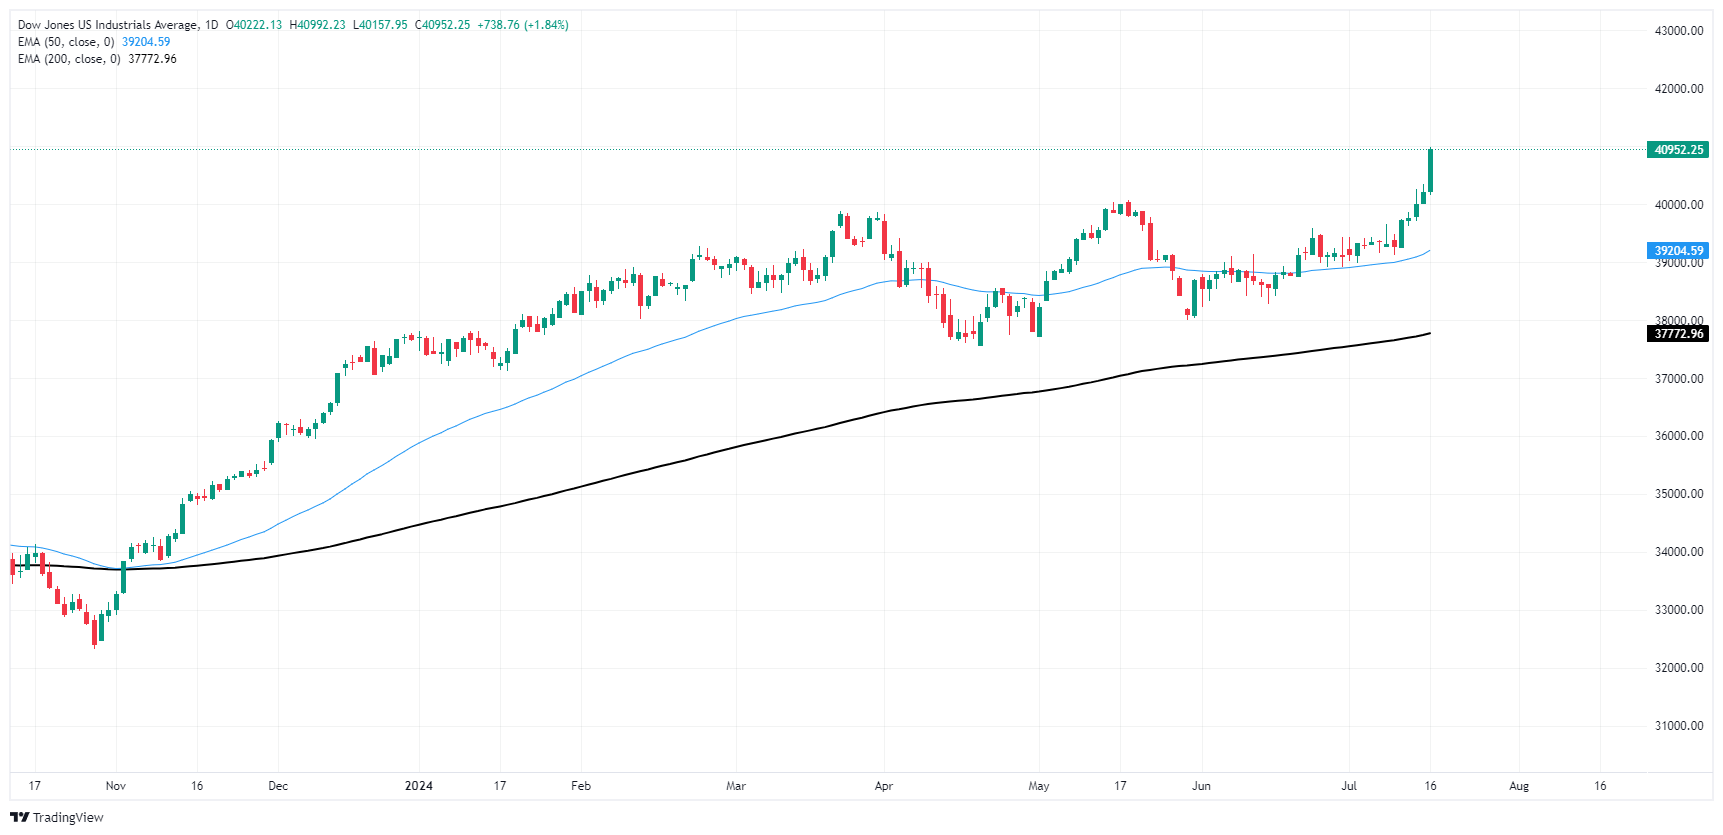
Dow Jones FAQs
The Dow Jones Industrial Average, one of the oldest stock market indices in the world, is compiled of the 30 most traded stocks in the US. The index is price-weighted rather than weighted by capitalization. It is calculated by summing the prices of the constituent stocks and dividing them by a factor, currently 0.152. The index was founded by Charles Dow, who also founded the Wall Street Journal. In later years it has been criticized for not being broadly representative enough because it only tracks 30 conglomerates, unlike broader indices such as the S&P 500.
Many different factors drive the Dow Jones Industrial Average (DJIA). The aggregate performance of the component companies revealed in quarterly company earnings reports is the main one. US and global macroeconomic data also contributes as it impacts on investor sentiment. The level of interest rates, set by the Federal Reserve (Fed), also influences the DJIA as it affects the cost of credit, on which many corporations are heavily reliant. Therefore, inflation can be a major driver as well as other metrics which impact the Fed decisions.
Dow Theory is a method for identifying the primary trend of the stock market developed by Charles Dow. A key step is to compare the direction of the Dow Jones Industrial Average (DJIA) and the Dow Jones Transportation Average (DJTA) and only follow trends where both are moving in the same direction. Volume is a confirmatory criteria. The theory uses elements of peak and trough analysis. Dow’s theory posits three trend phases: accumulation, when smart money starts buying or selling; public participation, when the wider public joins in; and distribution, when the smart money exits.
There are a number of ways to trade the DJIA. One is to use ETFs which allow investors to trade the DJIA as a single security, rather than having to buy shares in all 30 constituent companies. A leading example is the SPDR Dow Jones Industrial Average ETF (DIA). DJIA futures contracts enable traders to speculate on the future value of the index and Options provide the right, but not the obligation, to buy or sell the index at a predetermined price in the future. Mutual funds enable investors to buy a share of a diversified portfolio of DJIA stocks thus providing exposure to the overall index.
Author

Joshua Gibson
FXStreet
Joshua joins the FXStreet team as an Economics and Finance double major from Vancouver Island University with twelve years' experience as an independent trader focusing on technical analysis.


