Dow Jones Industrial Average Forecast: Risk of US government shutdown sends DJIA lower
- The Dow Jones Industrial Average lost 1.14% on Tuesday.
- DJI had already shed 1.89% last week as part of pullback that began in August.
- US Durable Goods Orders for August came in well above consensus.
- Apple partner restarts production after fire at India factory.
- Friday’s Personal Consumption Expenditures report for August will determine market’s view of interest rate cycle.

The Dow Jones Industrial Average (DJIA) loses more ground on Wednesday. Anxiety is still top of mind with rebellious members of the US House of Representatives refusing to allow continuing spending bills to reach the floor for a vote. With a vote on any of the separate spending bills, US Federal Government workers could be furloughed as soon as next week, and some government operations could even halt by Saturday.
Early Wednesday, the US Census Bureau released its August Durable Goods Orders data. The print arrived at 0.2%, much better than the -0.5% that had been forecast by analysts. It would seem the US economy is in much better shape than thought. However, when durable goods from the defense industry were excluded, orders dropped by 0.7%.
Dow component Apple (AAPL) said that its Taiwanese partner in India, Pegatron, had restarted production of iPhones on Wednesday after an electrical fire shut down the factory on Sunday. Dow member Disney (DIS) also opened narrowly higher after the Writers Guild of America ended its five-month strike with major movie studios.
Dow Jones News: US Government shutdown might curtail spending
Though it has been in the news for weeks, the Republican-controlled House of Representatives has refused to bring any of the 12 spending bills to the floor for a vote. Prior funding bills should run out this weekend, and already lawmakers are saying they do not have enough time to vote on the bills.
The Democratic-controlled Senate released a 79-page bill late Tuesday in an attempt to help the lower house of Congress with its negotiating process by extending funding through November 17.
Leaders of both parties in the Senate have proved bipartisan in the effort by bringing both of their caucuses together in support of the stop-gap measure.
“It will continue to fund the government at present levels while maintaining our commitment to Ukraine's security and humanitarian needs while also ensuring those impacted by natural disasters across the country begin to get the resources they need," Senate Majority Leader Chuck Schumer (D-NY) said Tuesday.
However, the situation in the House is being held up by a small band of Republicans headed by Florida Representative Matt Gaetz. It isn’t completely clear what Gaetz wants, but many speculate that the present impasse is merely an attempt to force House Speaker Kevin McCarthy (R-CA) to resign.
Other disciples of Gaetz take issue with a lack of Mexican border security funding in earlier versions of the bill, as well as a minority who dislike any further funding for Ukraine’s defensive war with Russia.
Experts say that as many as 800,000 federal workers will be furloughed starting next week if no deal can be finalized. In addition, the government’s inability to pay thousands of vendors could result in a slowing US economy, depending on how long the stand-off lasts. The shutdown in December 2018 ended up lasting more than one month.
August PCE data will be most-watched event on Friday
Core Personal Consumption Expenditure (PCE) data is the Federal Reserve’s (Fed) most trusted source for pinpointing inflation in the US economy. As luck would have it, the August data for the PCE arrives at 12:30 GMT / 8:30 EST on Friday.
Analyst consensus holds that monthly inflation grew at 0.2% in August, which is the same result as July. Annualized inflation is expected then to print at 3.9%, a much healthier level than July’s 4.3%.
Oil and thus Gasoline prices have been soaring so far in the second half of 2023. Neither of these directly is included in core PCE, but both will begin seeping into PCE as higher energy prices translate into higher prices for goods and services. Both WTI and Brent Oil contracts have extended their September gains above $90 a barrel.
Expect the Dow Jones index to collapse if core PCE comes in stronger than expectations. There is a lot of negative macro sentiment at the moment, and it does not seem like investors can bear one more negative data point. Higher inflation will lift expectations that the Fed has one more rate hike in its quiver, which the equity market is hoping won’t be used.
What they said about the market – Ian Shepherdson
Pantheon Macroeconomics’ Ian Shepherdeson, a trained economist, sees parallels between the December 2018 government shutdown and the present market reaction to a US government shutdown that may begin this weekend if the Republican-controlled House of Representatives fails to bring a funding bill to a floor vote.
"The stock market tanked in the weeks before the record government shutdown from December 22, 2018, through January 26, 2019, and is on course for a repeat performance this time around. The S&P 500 fell by 15.5% from its December 3 high to its low on December 22, as the shutdown began. [...] The market then rallied through the shutdown, recovering most of the lost ground before the federal government went back to work, and breaching the December 3 level again on February 22.”
Dow Jones FAQs
What is the Dow Jones?
The Dow Jones Industrial Average, one of the oldest stock market indices in the world, is compiled of the 30 most traded stocks in the US. The index is price-weighted rather than weighted by capitalization. It is calculated by summing the prices of the constituent stocks and dividing them by a factor, currently 0.152. The index was founded by Charles Dow, who also founded the Wall Street Journal. In later years it has been criticized for not being broadly representative enough because it only tracks 30 conglomerates, unlike broader indices such as the S&P 500.
What factors impact the Dow Jones Industrial Average?
Many different factors drive the Dow Jones Industrial Average (DJIA). The aggregate performance of the component companies revealed in quarterly company earnings reports is the main one. US and global macroeconomic data also contributes as it impacts on investor sentiment. The level of interest rates, set by the Federal Reserve (Fed), also influences the DJIA as it affects the cost of credit, on which many corporations are heavily reliant. Therefore, inflation can be a major driver as well as other metrics which impact the Fed decisions.
What is Dow Theory?
Dow Theory is a method for identifying the primary trend of the stock market developed by Charles Dow. A key step is to compare the direction of the Dow Jones Industrial Average (DJIA) and the Dow Jones Transportation Average (DJTA) and only follow trends where both are moving in the same direction. Volume is a confirmatory criteria. The theory uses elements of peak and trough analysis. Dow’s theory posits three trend phases: accumulation, when smart money starts buying or selling; public participation, when the wider public joins in; and distribution, when the smart money exits.
How can I trade the DJIA?
There are a number of ways to trade the DJIA. One is to use ETFs which allow investors to trade the DJIA as a single security, rather than having to buy shares in all 30 constituent companies. A leading example is the SPDR Dow Jones Industrial Average ETF (DIA). DJIA futures contracts enable traders to speculate on the future value of the index and Options provide the right, but not the obligation, to buy or sell the index at a predetermined price in the future. Mutual funds enable investors to buy a share of a diversified portfolio of DJIA stocks thus providing exposure to the overall index.
Dow Jones Industrial Average forecast
The Dow Jones fell on Tuesday below the 33,700 support level, which stems from its reinforcing nature during late June and early July. From here, the best bet is that the DJIA falls further over subsequent sessions to the June 6 bottom at 33,400.
A worse bet for bulls is that the DJIA drops all the way to the 32,500 to 32,800 demand range. That range was last tested in May of this year and looks like it may become useful once more. The daily chart shows the DJIA reaching 30 on the Relative Strength Index (RSI). Any reading below 30 means the index is at oversold levels, which may bring some bottom-feeding value investors into the fray for a change.
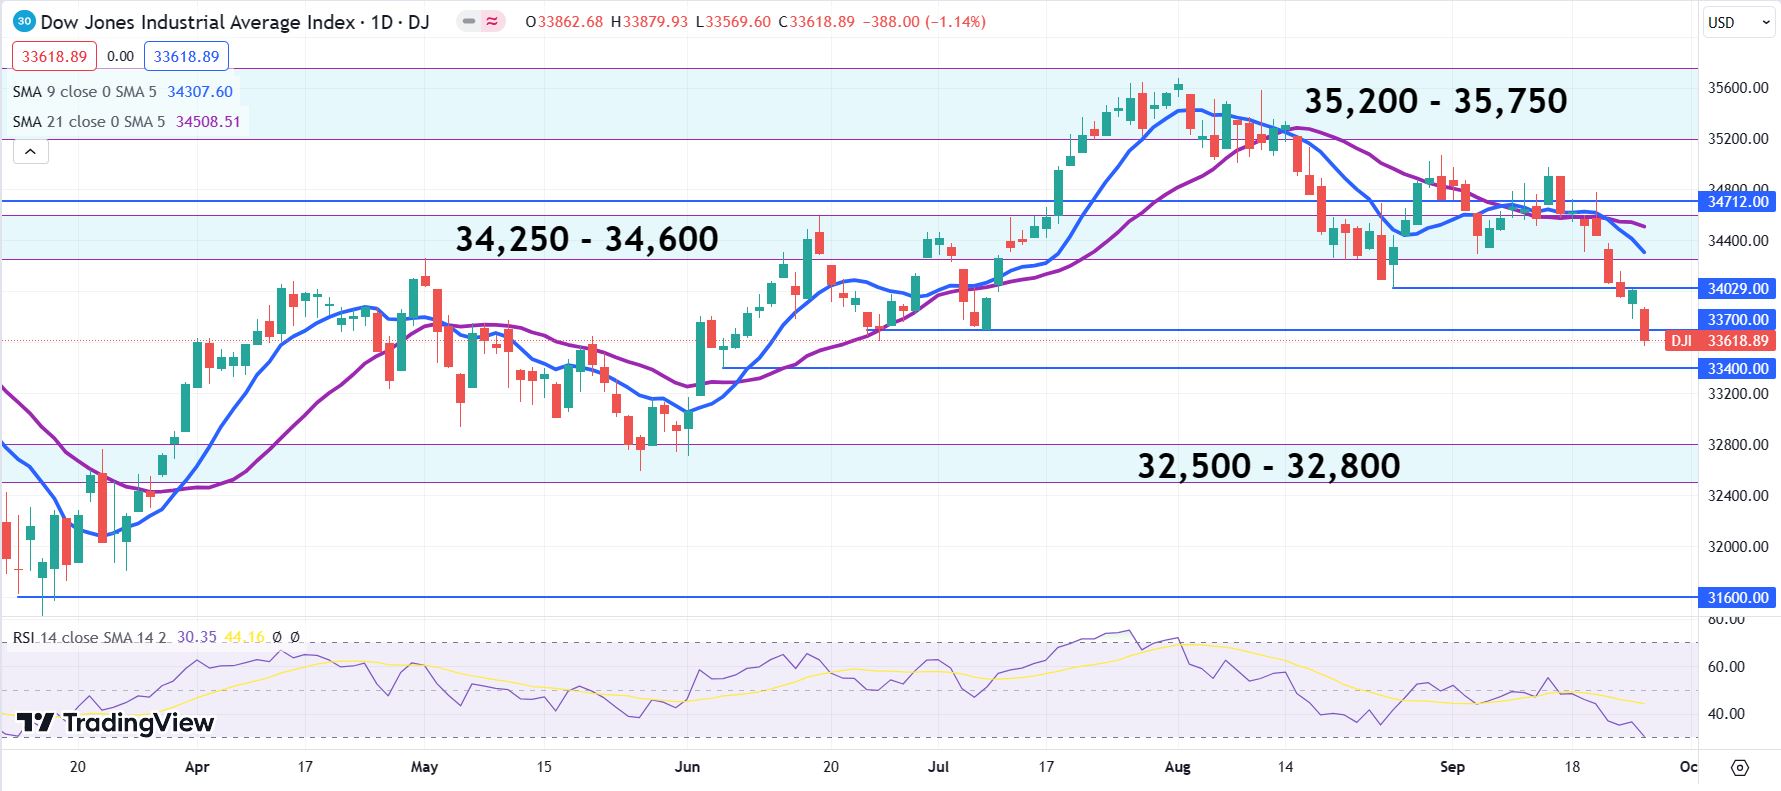
Dow Jones Industrial Average daily chart
Premium
You have reached your limit of 3 free articles for this month.
Start your subscription and get access to all our original articles.
Author

Clay Webster
FXStreet
Clay Webster grew up in the US outside Buffalo, New York and Lancaster, Pennsylvania. He began investing after college following the 2008 financial crisis.


