Dow Jones Industrial Average Forecast: DJIA ends Wednesday slightly lower before Disney issues mixed results
- Dow Jones has broken out of a three-month descending price channel.
- Fed’s Powell, Williams speak at event on Wednesday.
- Dow Jones Industrial Average gained 5.07% last week, the largest weekly gain since October 2022.
- Disney beat earnings consensus for Q4 but missed the average revenue forecast.
- Unemployment Rate, SLOOS report, credit card delinquencies provide possibility for recession in 2024.

The Dow Jones Industrial Average (DJIA) drifted 0.12% lower on Wednesday but cut its decline in half by the end of the session. US Treasury yields were mixed but declined sharply toward the back of the yield curve. Crude Oil prices plunged more than 2%. The NASDAQ Composite and S&P 500 advanced ever so slightly during a low-volatility session.
This was the first session in which the Dow registered a decline following seven gaining sessions. After the market close, Disney beat earnings expectations for its fourth quarter but missed revenue consensus. The stock advanced about 2%.
The DJIA reached a new range high on Tuesday after breaking out of a three-mong-long descending price channel last Friday. Last week saw the DJIA produce its best gain in a year at 5.07%. Gains have been light to start the week, but the daily chart is flashing a noticeable buy signal.
Wednesday began with a short speech by Federal Reserve Chair Jerome Powell at the Federal Reserve Division of Research & Statistics Centennial Conference. New York Federal Reserve President John Williams spoke later in the day as well, but nothing of major intrigue was stated by either official. The market is no longer expecting another interest rate hike.
Economic data shows signs of possible downturn
The US Unemployment Rate has climbed from 3.5% in July to 3.9% in October. While that is still low, this is the highest rate since January 2022. That makes Thursday’s Initial Jobless Claims data for the week ending November 3 more significant than normal.
Consensus expects Initial Jobless Claims to come in at 218K, one notch higher than the previous week’s 217K print. A much higher figure might spook the market.
Additionally, credit card delinquencies are now higher than they were in the pre-pandemic period. 3% of a record high $1.08 trillion of US credit card debt was at some stage of delinquency at the end of September.
“The continued rise in credit card delinquency rates is broad based across area income and region, but particularly pronounced among millennials and those with auto loans or student loans," wrote Donghoon Lee of the New York Fed.
A third sign of doom comes via Deutsche Bank’s research department. Based on October’s Senior Loan Officer Opinion Survey (SLOOS) on Bank Lending Practices, about 30% of banks have tightened their lending standards for small firm commercial and industrial loans. Deutsche Bank’s research says that when this has happened in the past, a recession appears about 90% of the time over the next 12 months.
Dow Jones FAQs
What is the Dow Jones?
The Dow Jones Industrial Average, one of the oldest stock market indices in the world, is compiled of the 30 most traded stocks in the US. The index is price-weighted rather than weighted by capitalization. It is calculated by summing the prices of the constituent stocks and dividing them by a factor, currently 0.152. The index was founded by Charles Dow, who also founded the Wall Street Journal. In later years it has been criticized for not being broadly representative enough because it only tracks 30 conglomerates, unlike broader indices such as the S&P 500.
What factors impact the Dow Jones Industrial Average?
Many different factors drive the Dow Jones Industrial Average (DJIA). The aggregate performance of the component companies revealed in quarterly company earnings reports is the main one. US and global macroeconomic data also contributes as it impacts on investor sentiment. The level of interest rates, set by the Federal Reserve (Fed), also influences the DJIA as it affects the cost of credit, on which many corporations are heavily reliant. Therefore, inflation can be a major driver as well as other metrics which impact the Fed decisions.
What is Dow Theory?
Dow Theory is a method for identifying the primary trend of the stock market developed by Charles Dow. A key step is to compare the direction of the Dow Jones Industrial Average (DJIA) and the Dow Jones Transportation Average (DJTA) and only follow trends where both are moving in the same direction. Volume is a confirmatory criteria. The theory uses elements of peak and trough analysis. Dow’s theory posits three trend phases: accumulation, when smart money starts buying or selling; public participation, when the wider public joins in; and distribution, when the smart money exits.
How can I trade the DJIA?
There are a number of ways to trade the DJIA. One is to use ETFs which allow investors to trade the DJIA as a single security, rather than having to buy shares in all 30 constituent companies. A leading example is the SPDR Dow Jones Industrial Average ETF (DIA). DJIA futures contracts enable traders to speculate on the future value of the index and Options provide the right, but not the obligation, to buy or sell the index at a predetermined price in the future. Mutual funds enable investors to buy a share of a diversified portfolio of DJIA stocks thus providing exposure to the overall index.
What they said about the market – Meredith Whitney
Analyst Meredith Whitney, who heads the Whitney Advisory Group, says that US housing prices are destined to begin a downtrend in 2024. Slightly more than half of Americans above the age of 50 are planning to downsize their homes. Since this group owns more than 70% of all US homes, this trend could push 30 million houses onto the market in the next few years. Whitney believes this trend will push enough supply onto the market that home prices will need to fall. Additionally, the high interest rate environment leading to higher mortgage payments will reduce the number of buyers until falling home prices help to pick up the slack.
“That's why prices have got to come down to be commensurate with rates. There's a mismatch here.”
Dow Jones Industrial Average forecast: Reason for optimism
Last Friday, the Dow Jones Industrial Average broke above the three-month downtrend that began on August 1. The break involved a gap up, a sign that the breach was likely not a false signal.
In addition, Tuesday’s close was slightly above the lower high on October 17. This means that the DJIA has created a new higher high, which is necessary if a longer-term rally is to begin.
The next stage will likely see the Dow Jones index reach resistance within the 34,300 to 34,7000 volume band. This region has acted as both support and resistance for most of 2023, so it is viewed with real significance. Bulls will look to enter once this week’s rally pulls back to retest the top trendline of the former price channel.
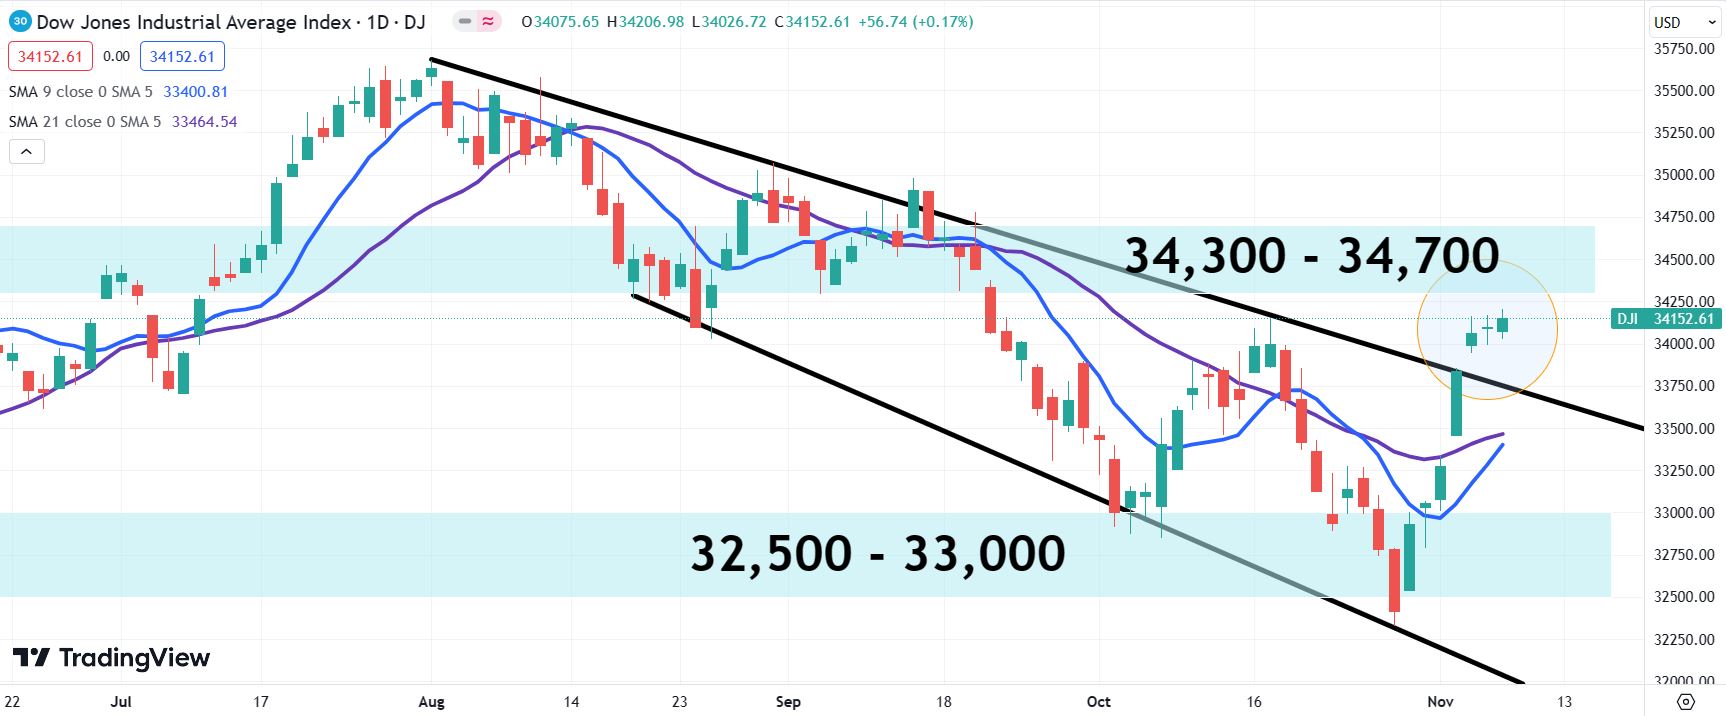
Dow Jones Industrial Average daily chart
Author

Clay Webster
FXStreet
Clay Webster grew up in the US outside Buffalo, New York and Lancaster, Pennsylvania. He began investing after college following the 2008 financial crisis.
















