Dow Jones Industrial Average loses momentum on middling Wednesday
- The Dow Jones rallied early Wednesday before dipping back to the open.
- US JOLTS data eased back more than expected in July.
- Markets have tilted further into bets of a double Fed cut in September.

The Dow Jones Industrial Average (DJIA) whipped on Wednesday, rising at the start of the US market session but falling back into the day’s opening bids after the opening volley of US labor data disappointed investors.
US JOLTS Job Openings in July missed the mark, adding 7.673 million available jobs compared to the forecast 8.1 million, compared to the previous month’s revised 7.91 million. With the Federal Reserve (Fed) broadly expected to begin cutting interest rates on September 18, markets are tilting further into bets of a 50 bps cut to kick off the next rate cutting cycle. Rate markets are still pricing in 100 bps in total cuts by the end of 2024, but there’s still a 57% chance of the Fed’s September rate call being a slimmer 25 bps, according to CME’s FedWatch Tool.
Friday's US Nonfarm Payrolls (NFP) report looms large and represents the last round of key US labor data before the Fed’s first rate trim. Friday's NFP print is widely expected to set the tone for market expectations regarding the depth of a Fed rate cut, with investors fully priced in on the start of a new rate-cutting cycle this month.
Economic Indicator
JOLTS Job Openings
JOLTS Job Openings is a survey done by the US Bureau of Labor Statistics to help measure job vacancies. It collects data from employers including retailers, manufacturers and different offices each month.
Read more.Last release: Wed Sep 04, 2024 14:00
Frequency: Monthly
Actual: 7.673M
Consensus: 8.1M
Previous: 8.184M
Source: US Bureau of Labor Statistics
Dow Jones news
The Dow Jones tilted into the low side on Wednesday, with two-thirds of the equity index testing into the red for the midweek market session. Travelers Companies (TRV) still managed to rise 1.4% to $231.12 per share, while Verizon Communications (VZ) stumbled to the bottom of the board, falling 3.7% to $19.34 per share.
Dow Jones price forecast
The Dow Jones couldn’t figure it out on Wednesday, rising early in the day to 41,160 before slumping back to the day’s opening prices just above 40,840. The DJIA is holding onto bullish chart paper near record highs approaching 41,600, but momentum has drained out of the bidders’ camp as price action shifts back down toward the 50-day Exponential Moving Average (EMA) at 40,253.
Dow Jones daily chart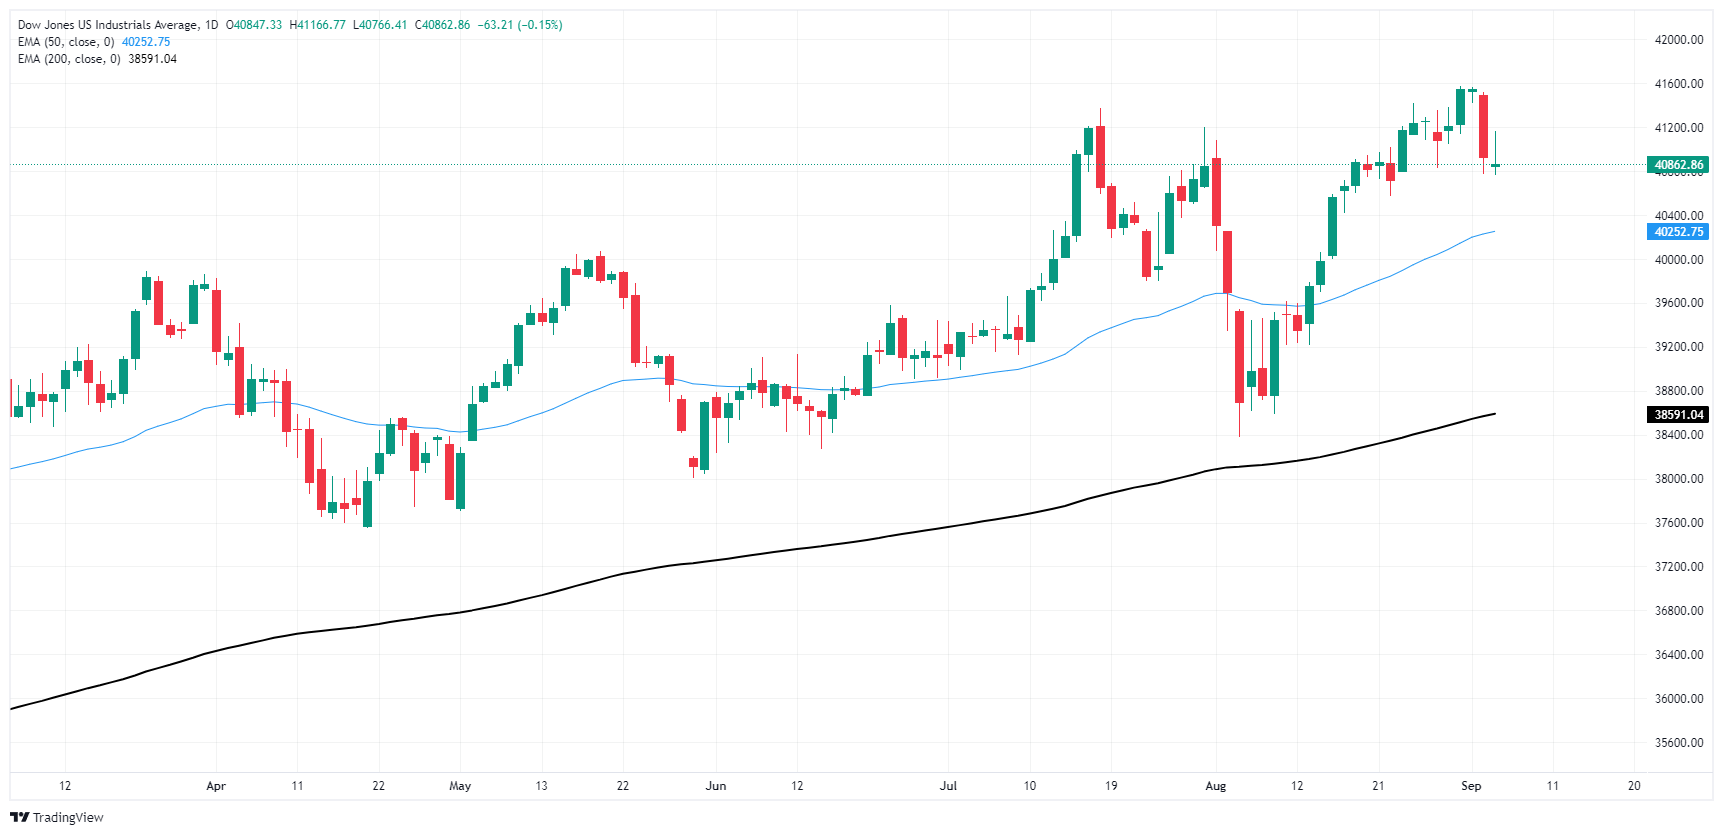
Dow Jones FAQs
The Dow Jones Industrial Average, one of the oldest stock market indices in the world, is compiled of the 30 most traded stocks in the US. The index is price-weighted rather than weighted by capitalization. It is calculated by summing the prices of the constituent stocks and dividing them by a factor, currently 0.152. The index was founded by Charles Dow, who also founded the Wall Street Journal. In later years it has been criticized for not being broadly representative enough because it only tracks 30 conglomerates, unlike broader indices such as the S&P 500.
Many different factors drive the Dow Jones Industrial Average (DJIA). The aggregate performance of the component companies revealed in quarterly company earnings reports is the main one. US and global macroeconomic data also contributes as it impacts on investor sentiment. The level of interest rates, set by the Federal Reserve (Fed), also influences the DJIA as it affects the cost of credit, on which many corporations are heavily reliant. Therefore, inflation can be a major driver as well as other metrics which impact the Fed decisions.
Dow Theory is a method for identifying the primary trend of the stock market developed by Charles Dow. A key step is to compare the direction of the Dow Jones Industrial Average (DJIA) and the Dow Jones Transportation Average (DJTA) and only follow trends where both are moving in the same direction. Volume is a confirmatory criteria. The theory uses elements of peak and trough analysis. Dow’s theory posits three trend phases: accumulation, when smart money starts buying or selling; public participation, when the wider public joins in; and distribution, when the smart money exits.
There are a number of ways to trade the DJIA. One is to use ETFs which allow investors to trade the DJIA as a single security, rather than having to buy shares in all 30 constituent companies. A leading example is the SPDR Dow Jones Industrial Average ETF (DIA). DJIA futures contracts enable traders to speculate on the future value of the index and Options provide the right, but not the obligation, to buy or sell the index at a predetermined price in the future. Mutual funds enable investors to buy a share of a diversified portfolio of DJIA stocks thus providing exposure to the overall index.
Author

Joshua Gibson
FXStreet
Joshua joins the FXStreet team as an Economics and Finance double major from Vancouver Island University with twelve years' experience as an independent trader focusing on technical analysis.


