- Dow Jones climbs 0.32% as investors grapple with pullback in consumer confidence.
- UoM Consumer Sentiment, Inflation Expectations come in worse than expected.
- Fedspeak dominates the headlines as policymakers talk down rate cut hopes.
The Dow Jones Industrial Average (DJIA) gained 125 points on Friday as equities try to shake off a decline in the University of Michigan’s Consumer Sentiment Index which showed US consumers are increasingly concerned about long-run inflation taking hold. Consumer 5-year Inflation Expectations ticked higher as the US economy begins to buckle under the weight of price growth runner even hotter and longer than previously expected.
The UoM’s Consumer Sentiment Index for May declined sharply to 67.4 in May, falling well below the market forecast 76.0 and hitting its lowest figure in six months as consumer confidence deteriorates. 5-year Consumer Inflation Expectations also ticked higher to 3.1% in May compared to the previous 3.0%.
Multiple Federal Reserve (Fed) officials hit the newswires on Friday as central planners try to talk down broad-market expectations for rate cuts in 2024 in the face of recent stubborn inflation figures.
Read more:
Fed’s Bowman: I don't see rate cuts as warranted this year
Fed's Goolsbee: Housing remains a significant inflation challenge
Fed's Logan: Too early to think about cutting rates
Dow Jones news
The Dow Jones Industrial Average was the top-performing US equity index on Friday, gaining around a third of a percent in the last market session of the trading week. A third of the securities that comprise the Dow Jones still declined on the day, with the losses being led by Nike Inc. (NKE). Nike lost -2.62% on Friday, declining below $91.00 per share. On the upside, McDonald's Corp. (MCD) pulled ahead of the rest of the pack, gaining 2.63%. McDonald's gained seven points to close Friday trading at $275.00 per share.
Dow Jones technical outlook
Despite hobbled risk appetite in broader markets, the Dow Jones managed to set a new peak for the week, trading into 39,579.23 before settling back to the 39,500.00 region. Top side momentum is set to stall with the Dow Jones appearing overextended. The major equity index is trading well above the 200-day Exponential Moving Average (EMA) at 36,893.00.
The Dow Jones ended a seventh consecutive day in the green, and the index is up around 2% for the week.
Dow Jones hourly chart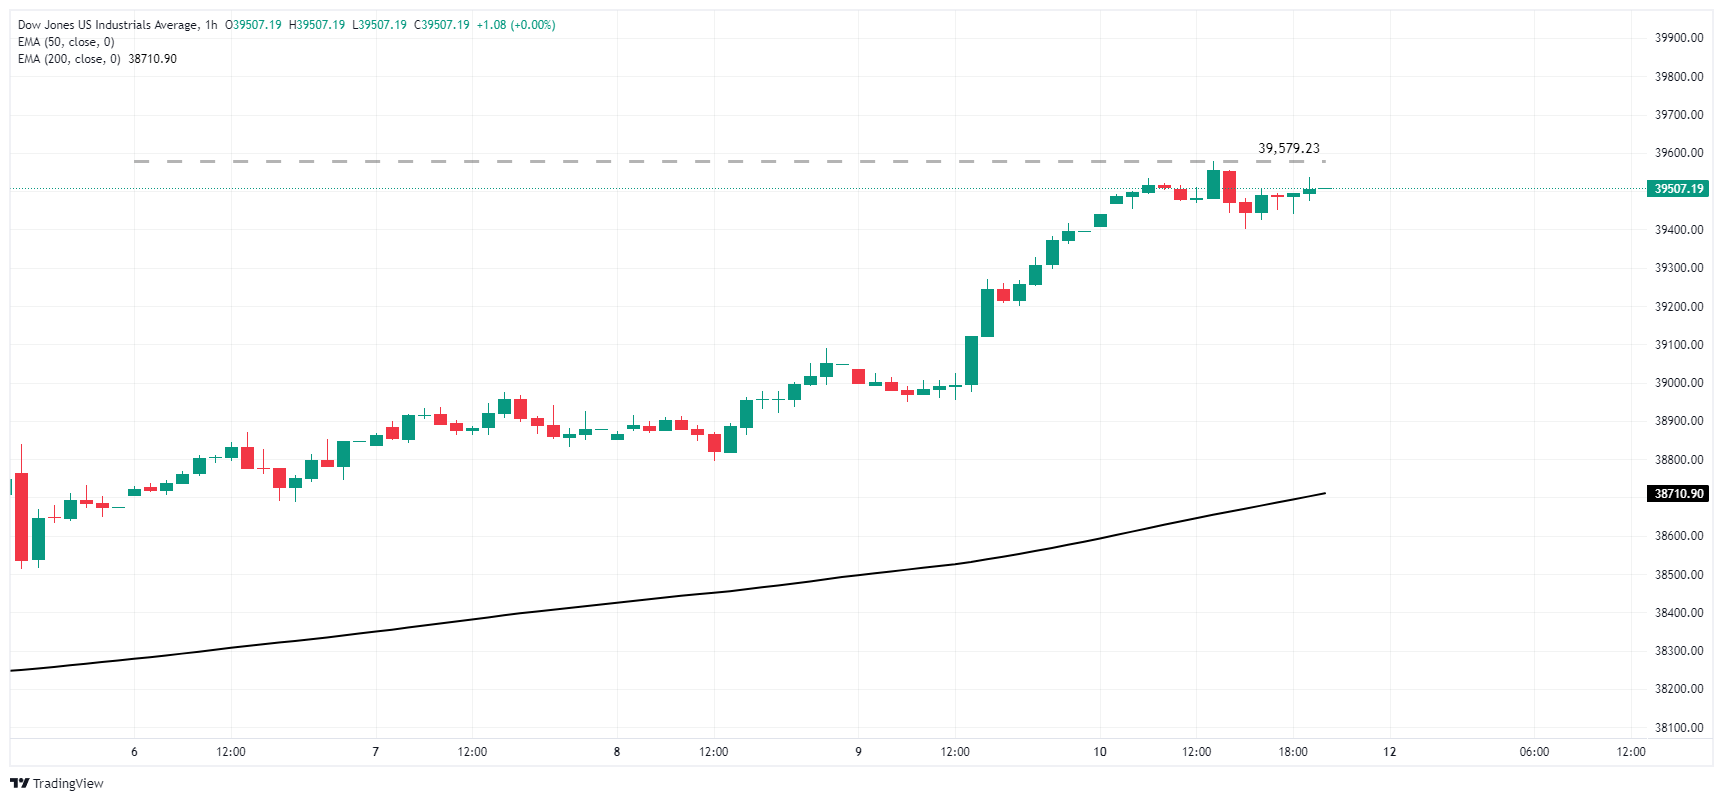
Dow Jones daily chart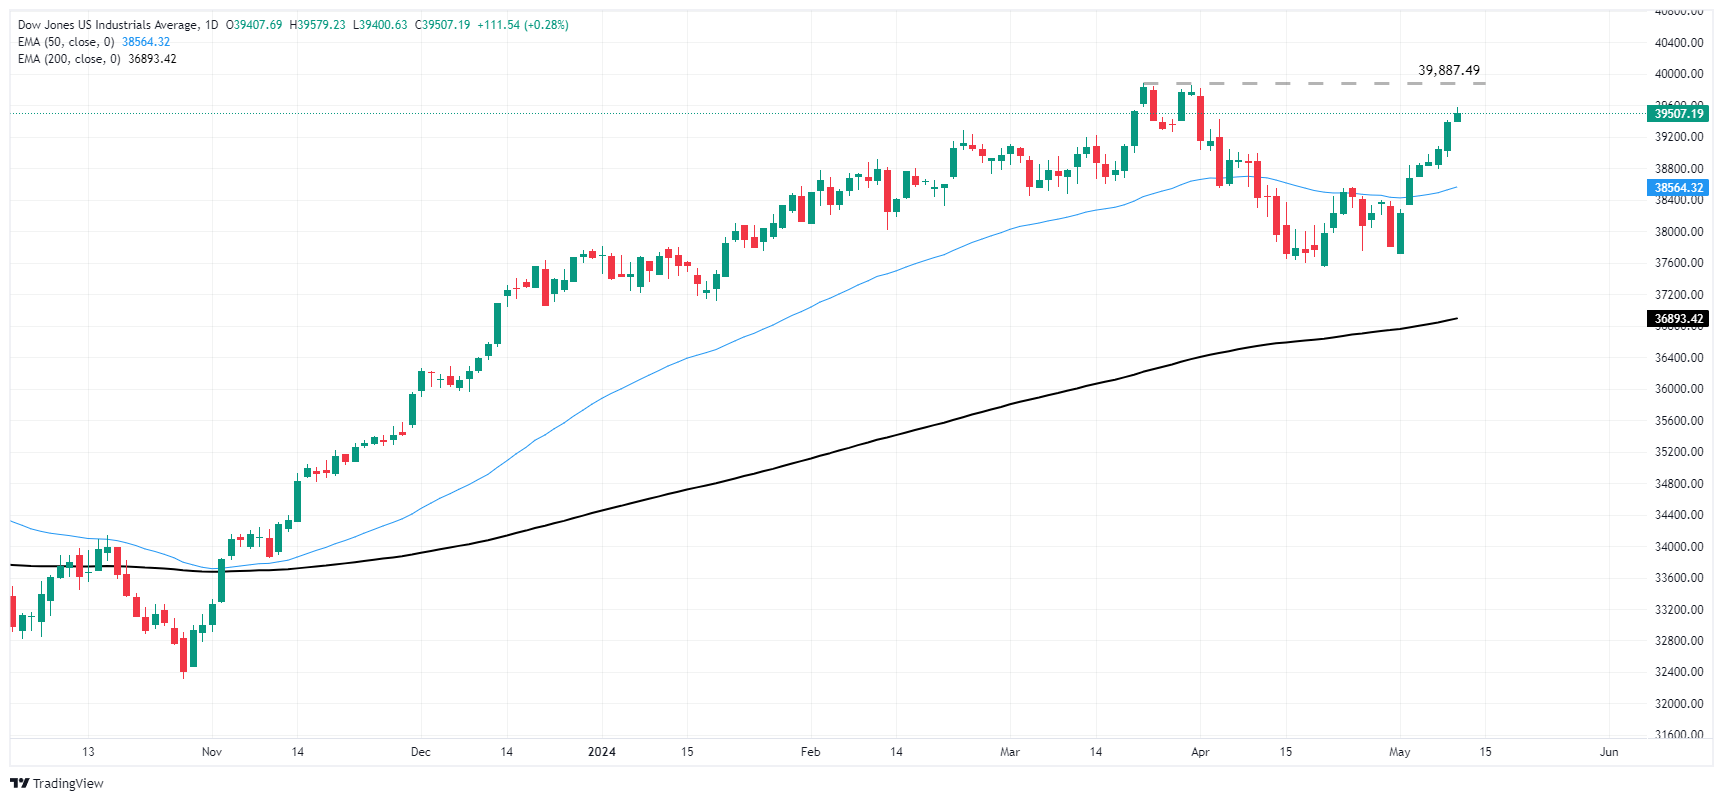
Dow Jones FAQs
The Dow Jones Industrial Average, one of the oldest stock market indices in the world, is compiled of the 30 most traded stocks in the US. The index is price-weighted rather than weighted by capitalization. It is calculated by summing the prices of the constituent stocks and dividing them by a factor, currently 0.152. The index was founded by Charles Dow, who also founded the Wall Street Journal. In later years it has been criticized for not being broadly representative enough because it only tracks 30 conglomerates, unlike broader indices such as the S&P 500.
Many different factors drive the Dow Jones Industrial Average (DJIA). The aggregate performance of the component companies revealed in quarterly company earnings reports is the main one. US and global macroeconomic data also contributes as it impacts on investor sentiment. The level of interest rates, set by the Federal Reserve (Fed), also influences the DJIA as it affects the cost of credit, on which many corporations are heavily reliant. Therefore, inflation can be a major driver as well as other metrics which impact the Fed decisions.
Dow Theory is a method for identifying the primary trend of the stock market developed by Charles Dow. A key step is to compare the direction of the Dow Jones Industrial Average (DJIA) and the Dow Jones Transportation Average (DJTA) and only follow trends where both are moving in the same direction. Volume is a confirmatory criteria. The theory uses elements of peak and trough analysis. Dow’s theory posits three trend phases: accumulation, when smart money starts buying or selling; public participation, when the wider public joins in; and distribution, when the smart money exits.
There are a number of ways to trade the DJIA. One is to use ETFs which allow investors to trade the DJIA as a single security, rather than having to buy shares in all 30 constituent companies. A leading example is the SPDR Dow Jones Industrial Average ETF (DIA). DJIA futures contracts enable traders to speculate on the future value of the index and Options provide the right, but not the obligation, to buy or sell the index at a predetermined price in the future. Mutual funds enable investors to buy a share of a diversified portfolio of DJIA stocks thus providing exposure to the overall index.
Information on these pages contains forward-looking statements that involve risks and uncertainties. Markets and instruments profiled on this page are for informational purposes only and should not in any way come across as a recommendation to buy or sell in these assets. You should do your own thorough research before making any investment decisions. FXStreet does not in any way guarantee that this information is free from mistakes, errors, or material misstatements. It also does not guarantee that this information is of a timely nature. Investing in Open Markets involves a great deal of risk, including the loss of all or a portion of your investment, as well as emotional distress. All risks, losses and costs associated with investing, including total loss of principal, are your responsibility. The views and opinions expressed in this article are those of the authors and do not necessarily reflect the official policy or position of FXStreet nor its advertisers. The author will not be held responsible for information that is found at the end of links posted on this page.
If not otherwise explicitly mentioned in the body of the article, at the time of writing, the author has no position in any stock mentioned in this article and no business relationship with any company mentioned. The author has not received compensation for writing this article, other than from FXStreet.
FXStreet and the author do not provide personalized recommendations. The author makes no representations as to the accuracy, completeness, or suitability of this information. FXStreet and the author will not be liable for any errors, omissions or any losses, injuries or damages arising from this information and its display or use. Errors and omissions excepted.
The author and FXStreet are not registered investment advisors and nothing in this article is intended to be investment advice.
Recommended content
Editors’ Picks
EUR/USD extends slide below 1.0700 on stronger USD, EU political angst

EUR/USD stays under bearish pressure and trades at its lowest level since early May below 1.0700. Unabated US Dollar demand amid risk aversion and looming EU political uncertainty exert downside pressure on the pair heading into the weekend.
GBP/USD slumps to multi-week lows below 1.2700

GBP/USD extends its decline on Friday and trades at its lowest level in nearly a month below 1.2700. In the absence of high-tier data releases, the US Dollar continues to benefit from souring market mood, forcing the pair to stretch lower in the second half of the day.
Gold clings to recovery gains at around $2,330

Following Thursday's pullback, Gold holds its ground on Friday and trades in positive territory near $2,330. The benchmark 10-year US Treasury bond yield edges lower toward 4.2%, helping XAU/USD push higher ahead of the weekend.
Monero price poised for a downward correction

Monero price has encountered resistance at a critical level. The technical outlook suggests a potential short-term correction as momentum indicators signal a bearish divergence.
Week ahead – RBA, SNB and BoE next to decide, CPI and PMI data also on tap

It will be another central-bank-heavy week with the RBA, SNB and BoE. Retail sales will be the highlight in the United States. Plenty of other data also on the way, including flash PMIs and UK CPI.