Dow Jones Industrial Average climbs 240 points on Wednesday as rate cut rally extends
- Dow Jones climbs on Wednesday as Fedspeak keeps rate cut hopes pinned.
- Fed rate cut expectations have fully priced in a September rate cut.
- One last batch of US inflation figures remains before the Fed’s July rate call.

The Dow Jones Industrial Average (DJIA) clipped into further gains on Wednesday, extending the week’s hard rally on sky-high rate cut expectations and stepped into yet another all-time record high in intraday trading. Investors are piling into securities poised to capitalize on broadly-expected Federal Reserve (Fed) rate cuts.
According to the CME’s FedWatch Tool, rate markets have fully priced in a rate cut when the Federal Open Market Committee (FOMC) gathers for a rate call on September 18. Rate traders currently see 98% odds of a first quarter-point rate cut in September, and particularly wistful markets are pricing in up to three cuts by the end of 2024, well above the Fed’s own forecast of one or two.
As markets weigh odds of the Fed getting bullied into a rate cut cycle by cooling inflation data, one last round of US inflation figures remains on the data docket before the Fed’s July rate meeting on July 31. US Personal Consumption Expenditures Price Index (PCE) inflation is due on Friday, July 26 and represents the last key inflation data that will contour investor expectations for Fed forward guidance heading deeper into the second half of the year.
Dow Jones news
Dow Jones is getting dragged higher on Wednesday, with over two-thirds of the index firmly in the green for the day, with losses concentrated once again in key tech sector companies. Amazon.com Inc. (AMZN) tumbled -3.3% to $186.66 per share on Wednesday, closely followed by Apple Inc. (AAPL) which backslid -2.5% to $228.87 per share. On the high side, Unitedhealth Group Inc. (UNH) soared another 4.0%, setting a new all-time high above $571.00 per share.
Dow Jones technical outlook
The Dow Jones Industrial Average has put the rubber to the road, extending into record highs another 250 points on Wednesday and chalking up a sixth straight trading day of firm gains. DJIA has climbed nearly 5% over six consecutive trading sessions.
With Dow Jones etching in a fresh record high of 41,185.87, bearish technicals have evaporated and short interest will be waiting for a pullback before even bothering trying to drag bids back down to the 200-day Exponential Moving Average (EMA) at 37,822.88.
Dow Jones five minute chart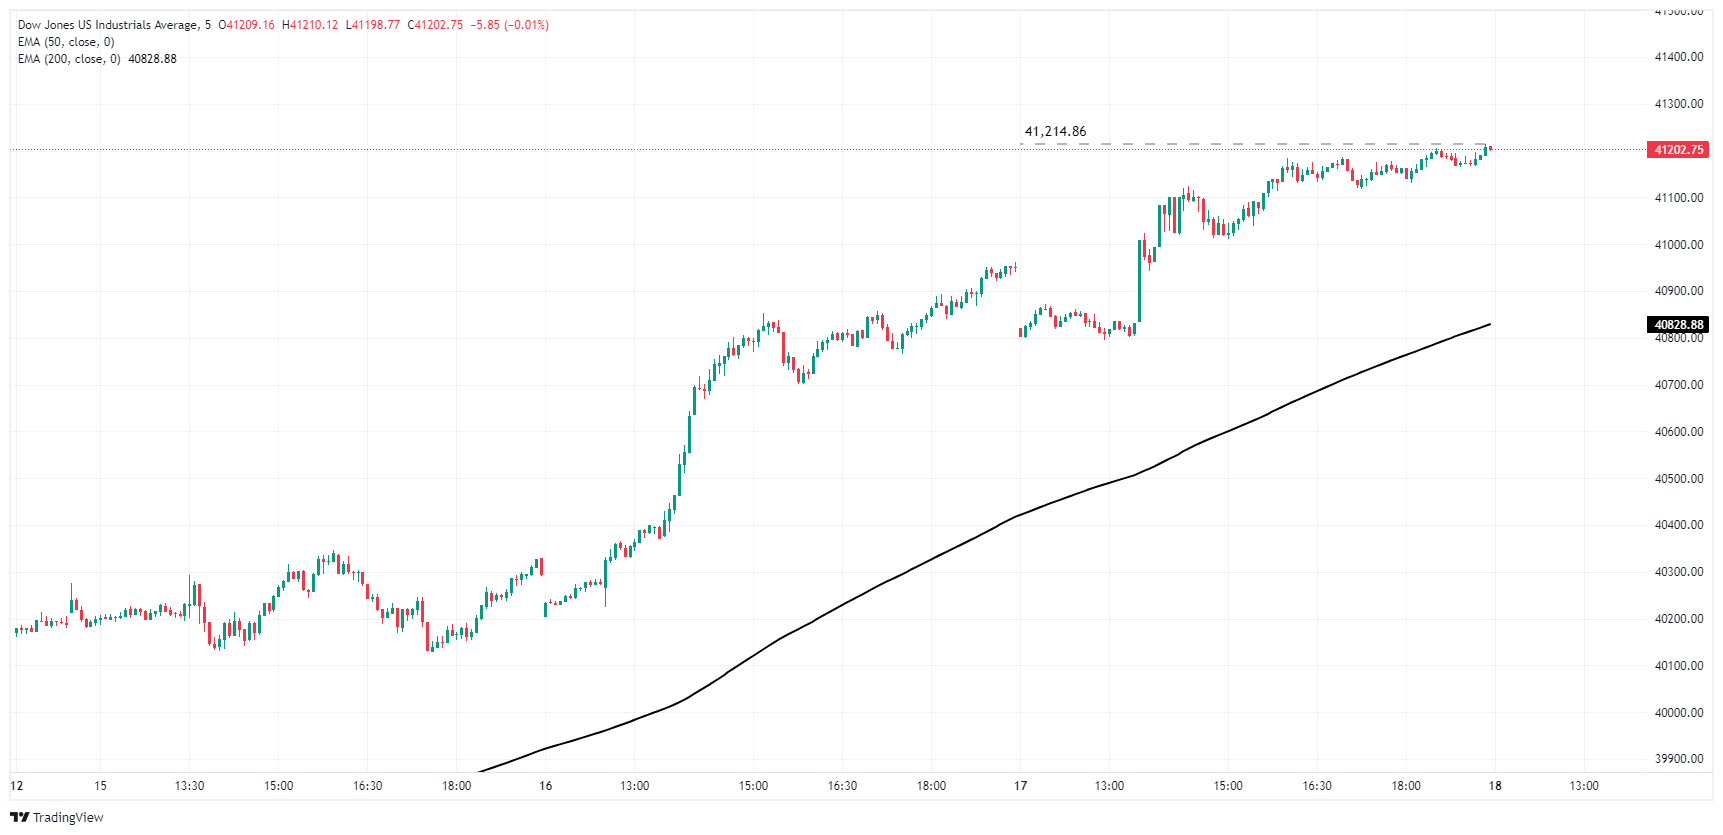
Dow Jones daily chart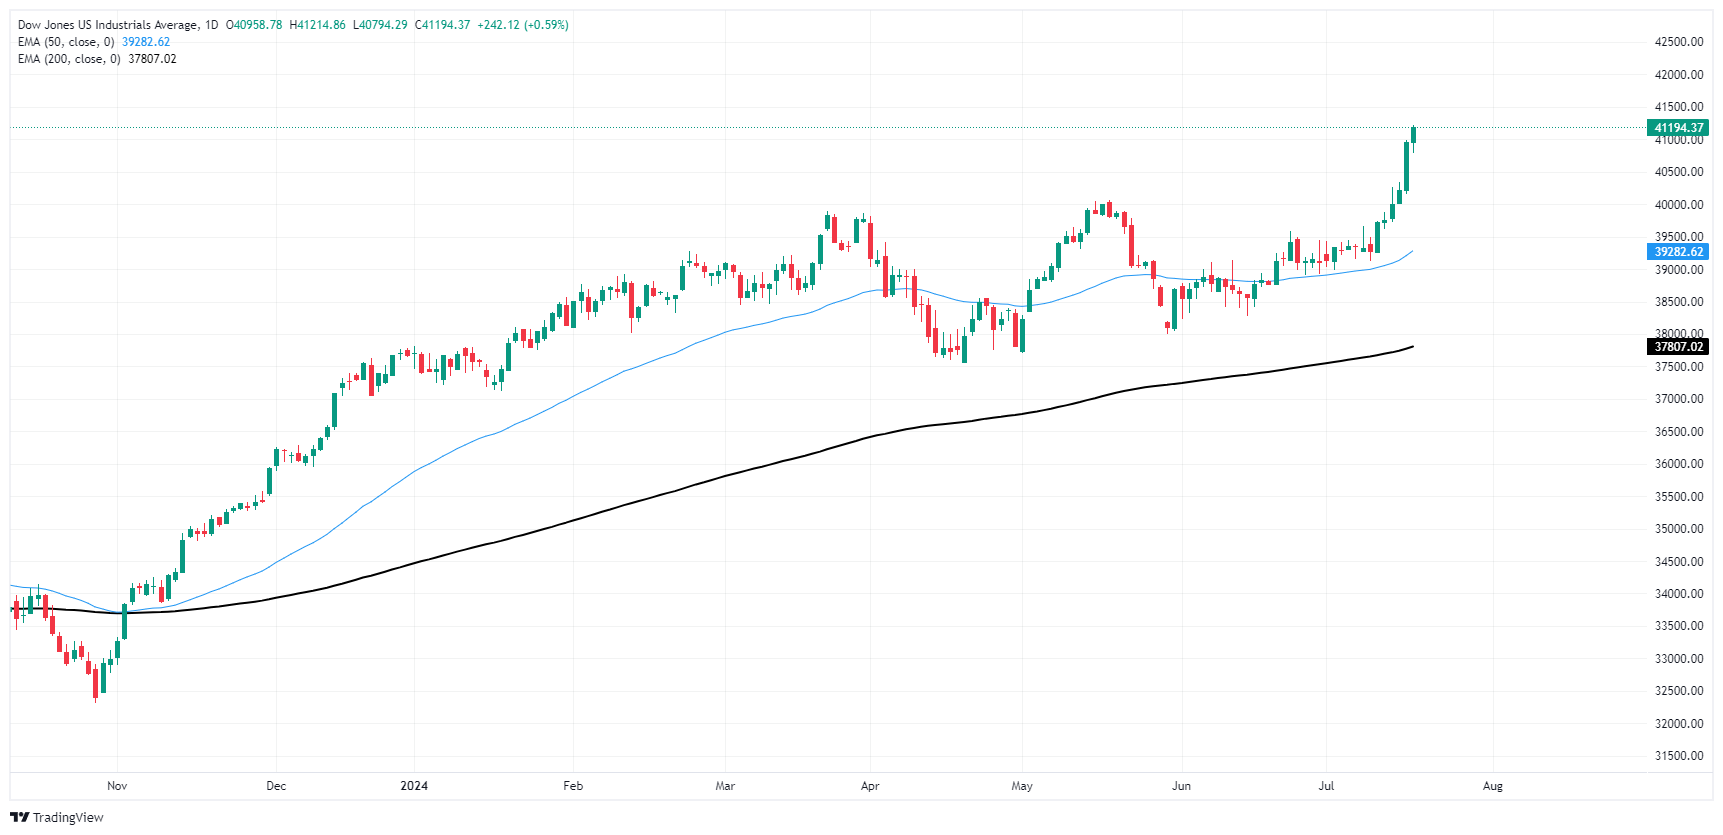
Dow Jones FAQs
The Dow Jones Industrial Average, one of the oldest stock market indices in the world, is compiled of the 30 most traded stocks in the US. The index is price-weighted rather than weighted by capitalization. It is calculated by summing the prices of the constituent stocks and dividing them by a factor, currently 0.152. The index was founded by Charles Dow, who also founded the Wall Street Journal. In later years it has been criticized for not being broadly representative enough because it only tracks 30 conglomerates, unlike broader indices such as the S&P 500.
Many different factors drive the Dow Jones Industrial Average (DJIA). The aggregate performance of the component companies revealed in quarterly company earnings reports is the main one. US and global macroeconomic data also contributes as it impacts on investor sentiment. The level of interest rates, set by the Federal Reserve (Fed), also influences the DJIA as it affects the cost of credit, on which many corporations are heavily reliant. Therefore, inflation can be a major driver as well as other metrics which impact the Fed decisions.
Dow Theory is a method for identifying the primary trend of the stock market developed by Charles Dow. A key step is to compare the direction of the Dow Jones Industrial Average (DJIA) and the Dow Jones Transportation Average (DJTA) and only follow trends where both are moving in the same direction. Volume is a confirmatory criteria. The theory uses elements of peak and trough analysis. Dow’s theory posits three trend phases: accumulation, when smart money starts buying or selling; public participation, when the wider public joins in; and distribution, when the smart money exits.
There are a number of ways to trade the DJIA. One is to use ETFs which allow investors to trade the DJIA as a single security, rather than having to buy shares in all 30 constituent companies. A leading example is the SPDR Dow Jones Industrial Average ETF (DIA). DJIA futures contracts enable traders to speculate on the future value of the index and Options provide the right, but not the obligation, to buy or sell the index at a predetermined price in the future. Mutual funds enable investors to buy a share of a diversified portfolio of DJIA stocks thus providing exposure to the overall index.
Author

Joshua Gibson
FXStreet
Joshua joins the FXStreet team as an Economics and Finance double major from Vancouver Island University with twelve years' experience as an independent trader focusing on technical analysis.

















