Dow Jones Industrial Average recovery runs out of gas on Wednesday
- Dow Jones extends into a second day of recovery after recent backslide.
- Markets have shrugged off recession fears, back to waiting for Fed cuts.
- Rate markets pricing in a double cut in September, two more to follow in 2024.

The Dow Jones Industrial Average (DJIA) Found further room on the high end early Wednesday as market sentiment recovers its footing and equities begin the slow climb back up after a three-day bearish plunge that kicked off last week. Despite an early bullish tilt, the Dow Jones is struggling to maintain topside momentum, and the equity index lagged into the late side of the US market session.
Investors briefly became concerned about the very real chance of a broad recession within the US economy, sparked by a downside tilt to the latest batch of growth and labor figures. With the latest rough patch in the rearview mirror, markets are back to keeping hopes pinned for a September rate cut from the Federal Reserve (Fed).
At the current cut, rate traders are pricing in roughly two-to-one odds of a 50-basis-point rate trim from the Fed on September 18, with a further two cuts expected through the rest of 2024. According to the CME’s FedWatch Tool, rate probabilities see an 83% chance of the Fed’s benchmark fed funds rate hitting 425-450 basis points by the end of December.
Dow Jones news
Despite a late-day pivot back into the low end, most of the Dow Jones’ listed equities are in the green on Wednesday, with most losses concentrated in Amgen Inc. (AMGN). Amgen fell -6.17% to $308.76 per share after reporting a mixed Q2 financial outlook, but investors are hopeful that Amgen’s weight loss drug competitor to other dominant names in the burgeoning field will help bolster the drugmaker in the future.
Apple Inc. (AAPL) is on the high end for Wednesday, climbing 1.8% to around $211.00 per share as the tech company’s stock recovers from a recent downside push after it was revealed that investing giant Warren Buffett had sold off shares in Apple, dragging Apple’s share of Berkshire Hathaway’s total portfolio down to 30% in Q2 2024 from 49% in Q4 2023.
Dow Jones price forecast
The Dow Jones is on pace to extend a bullish recovery from a near-term floor just below 38,500.00. Despite a three-day plunge that dragged the major index down over 6.5%, bids are stepping back into the chart to halt declines and price action continues to hold on the north side of the 200-day Exponential Moving Average (EMA) at 38,092.73.
The Dow Jones is still on the low side of all-time highs set at 41,371.38 in July, but bulls are dragging prices back towards the 50-day EMA at 39,606.00.
Dow Jones daily chart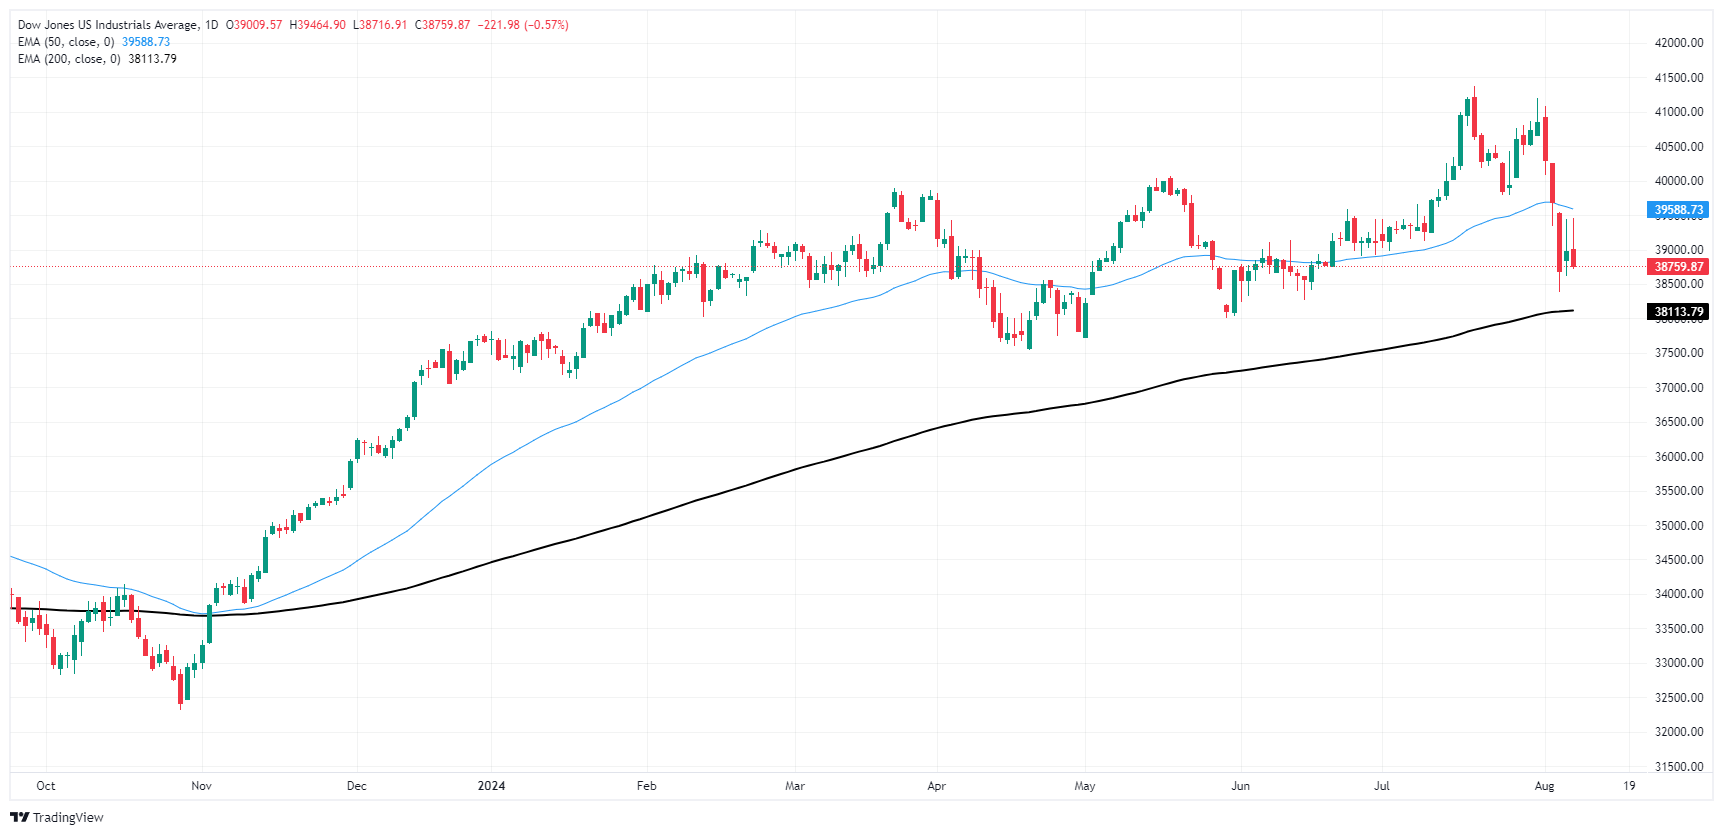
Dow Jones FAQs
The Dow Jones Industrial Average, one of the oldest stock market indices in the world, is compiled of the 30 most traded stocks in the US. The index is price-weighted rather than weighted by capitalization. It is calculated by summing the prices of the constituent stocks and dividing them by a factor, currently 0.152. The index was founded by Charles Dow, who also founded the Wall Street Journal. In later years it has been criticized for not being broadly representative enough because it only tracks 30 conglomerates, unlike broader indices such as the S&P 500.
Many different factors drive the Dow Jones Industrial Average (DJIA). The aggregate performance of the component companies revealed in quarterly company earnings reports is the main one. US and global macroeconomic data also contributes as it impacts on investor sentiment. The level of interest rates, set by the Federal Reserve (Fed), also influences the DJIA as it affects the cost of credit, on which many corporations are heavily reliant. Therefore, inflation can be a major driver as well as other metrics which impact the Fed decisions.
Dow Theory is a method for identifying the primary trend of the stock market developed by Charles Dow. A key step is to compare the direction of the Dow Jones Industrial Average (DJIA) and the Dow Jones Transportation Average (DJTA) and only follow trends where both are moving in the same direction. Volume is a confirmatory criteria. The theory uses elements of peak and trough analysis. Dow’s theory posits three trend phases: accumulation, when smart money starts buying or selling; public participation, when the wider public joins in; and distribution, when the smart money exits.
There are a number of ways to trade the DJIA. One is to use ETFs which allow investors to trade the DJIA as a single security, rather than having to buy shares in all 30 constituent companies. A leading example is the SPDR Dow Jones Industrial Average ETF (DIA). DJIA futures contracts enable traders to speculate on the future value of the index and Options provide the right, but not the obligation, to buy or sell the index at a predetermined price in the future. Mutual funds enable investors to buy a share of a diversified portfolio of DJIA stocks thus providing exposure to the overall index.
Author

Joshua Gibson
FXStreet
Joshua joins the FXStreet team as an Economics and Finance double major from Vancouver Island University with twelve years' experience as an independent trader focusing on technical analysis.


