Dow Jones Industrial Average sets new record high before tumbling 500 points on Thursday
- Dow Jones rose into a fifth consecutive all-time high before receding on Thursday.
- Equities are paring back after a heady rally on rate cut hopes.
- September rate cut is fully priced in, Fed hold at the end of July expected.

The Dow Jones Industrial Average (DJIA) rallied into yet another record high on Thursday before turning lower and following the broader market into a soft pullback that dragged intraday prices back into the midweek range. The Dow Jones is trading firmly above the 40,000.00 major price handle after getting buoyed into all-time highs by investor expectations of a September rate cut getting pinned to the ceiling.
According to the CME’s FedWatch Tool, rate markets are pricing in over 98% odds of at least a quarter-point rate trim from the Federal Reserve (Fed) in September. Some particularly adventurous rate traders are pricing in a 5% chance of a first cut in July, but odds remain low at 5%.
Thursday’s Initial Jobless Claims print helped to keep rate cut hopes bolstered after the number of new jobless benefits seekers rose to 243K for the week ended July 12, well above the previous week’s revised 223K and vaulting over the forecast 230K. While jobless claims aren’t a market-mover, it helps add weight to expectations of a continued loosening in the US job market, a key component alongside inflation figures to help bully the Fed into a rate cutting cycle.
Dow Jones news
Despite easing back into the low end on Thursday, the Dow Jones is roughly on-balance, with about half of the index’s constituent equities in the green for the day. Intel Corp. (INTC) rose over 3% to $35.52 per share despite an overall decline in the chipmaking sector. Banking dominated the low end on Thursday, with JPMorgan Chase & Co. (JPM) and Goldman Sachs Group Inc. (GS) both declining. JPM shed -2.85% to $210.69 per share while GS eased lower -2.43% to $489.98 per share.
Dow Jones technical outlook
After hitting a fifth consecutive all-time high of 41,37138 on Thursday, the Dow Jones index fell back below 40,900.00 as bulls take a much-needed breather. The Dow Jones closed in the green for six straight trading days, rallying nearly 5.5% in the process.
The Dow Jones’ latest bullish push has sent prices well into record highs, and even Thursday’s moderate pullback of -500 points still leaves prices buried deep in bull country, trading nearly 4% above the 50-day Exponential Moving Average (EMA) at 39,345.00.
Dow Jones five minute chart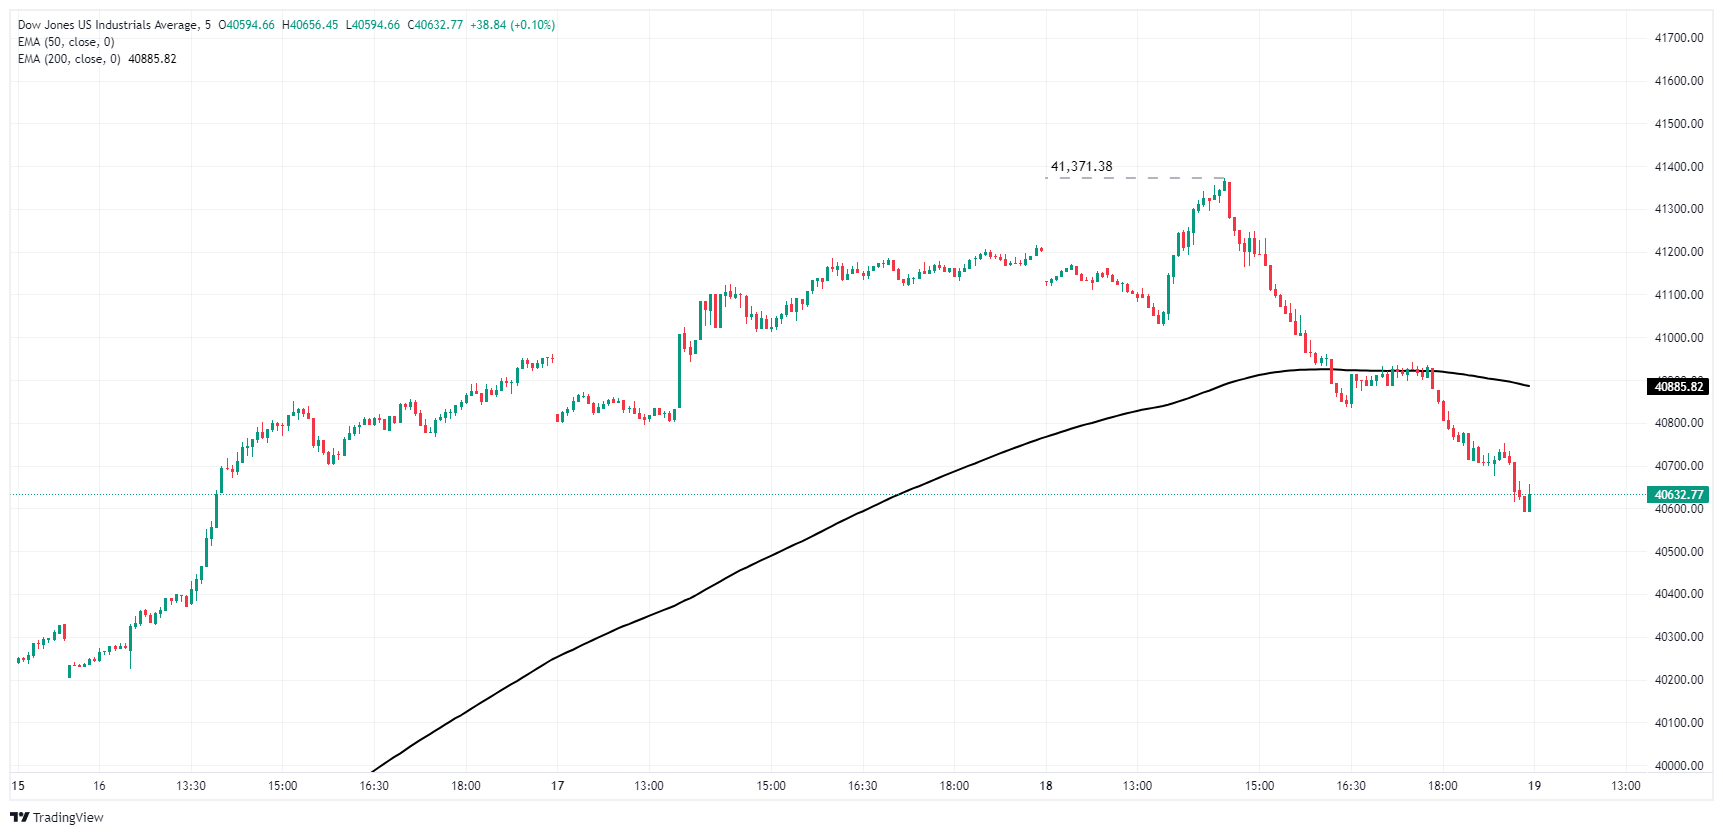
Dow Jones daily chart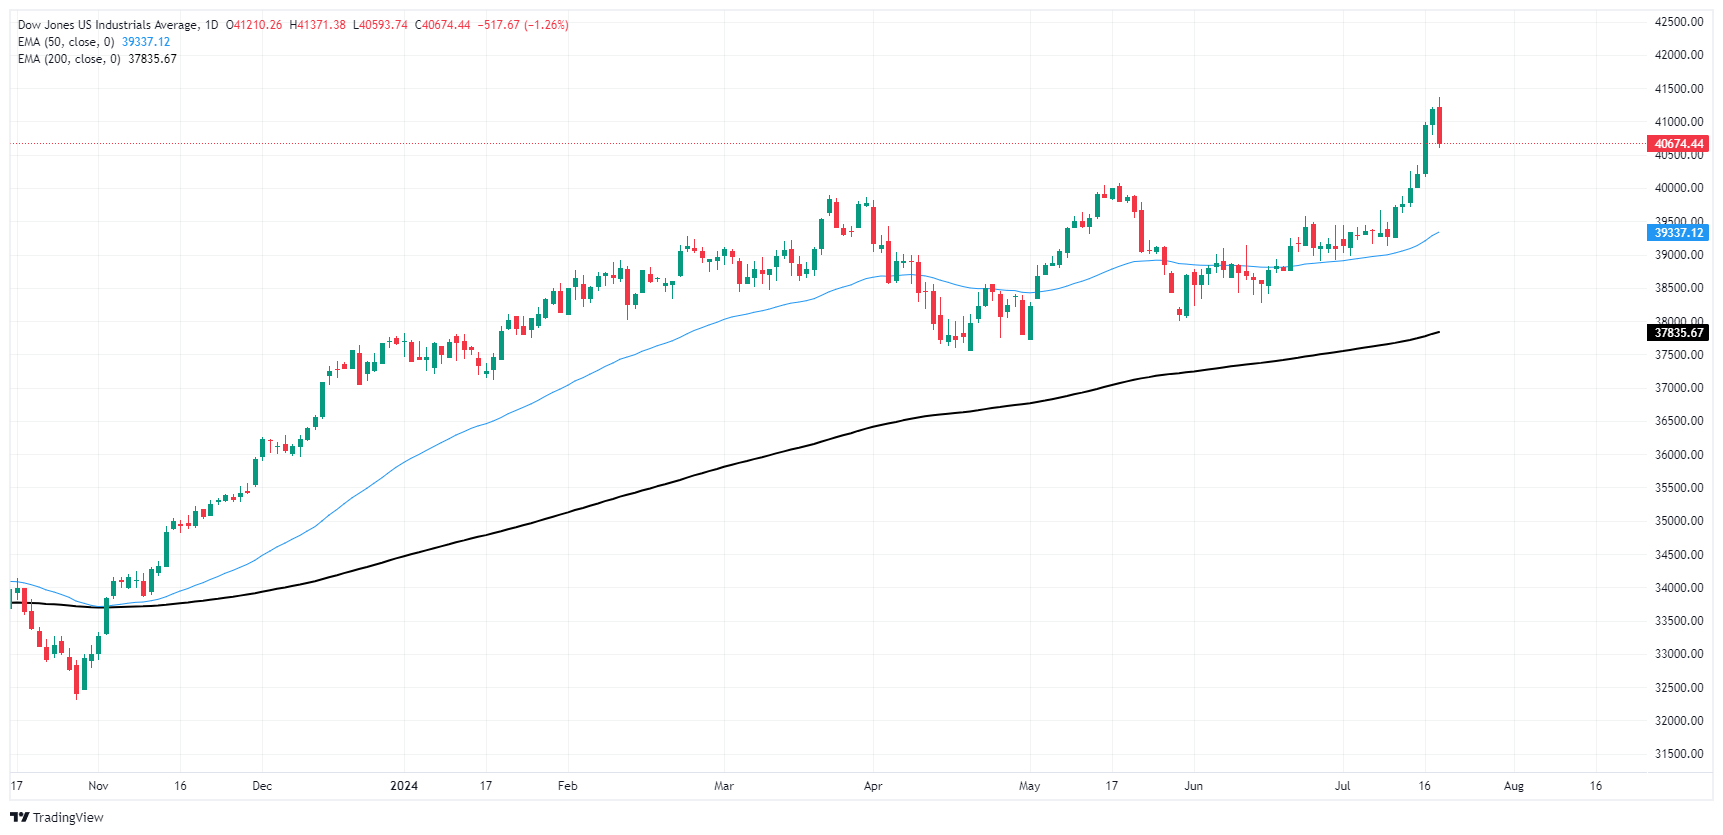
Economic Indicator
Continuing Jobless Claims
The Continuing Jobless Claims released by the US Department of Labor measure the number of individuals who are unemployed and are currently receiving unemployment benefits. It is representative of the strength of the labor market. A rise in this indicator has negative implications for consumer spending which discourages economic growth. Generally speaking, a high reading is seen as bearish for the US Dollar (USD), while a low reading is seen as bullish.
Read more.Last release: Thu Jul 18, 2024 12:30
Frequency: Weekly
Actual: 1.867M
Consensus: 1.86M
Previous: 1.852M
Source: US Department of Labor
Author

Joshua Gibson
FXStreet
Joshua joins the FXStreet team as an Economics and Finance double major from Vancouver Island University with twelve years' experience as an independent trader focusing on technical analysis.


