Dow Jones Industrial Average grinds into the midrange after mixed US data flummoxes risk appetite
- Dow Jones continues to churn just above 39,000.00 after Thursday’s mixed data.
- US data came in mixed on Thursday, leaving the American market session in the lurch.
- Investors now pivot to face Friday’s US PCE Price Index inflation print.

The Dow Jones Industrial Average (DJIA) went sideways on Thursday, finding tentative gains but battling the downside as traders grapple with a mixed print on the US data docket. US Initial Jobless Claims printed better than expected, but still on the higher end of recent figures, while US Personal Consumption Expenditures (PCE) rose faster than expected in Q1. Equities will now be on the lookout for Friday’s US PCE Price Index inflation, which is still expected to show an overall easing in core price pressures in May.
US Initial Jobless Claims for the week ended Jun 21 came in better than expected, showing 233K net new jobless benefits seekers compared to the forecast 236K, and down slightly further from the previous week’s 238K. The four-week average for Initial Jobless Claims jumped to 236K, bringing the newest week-on-week figure back below the running average.
US Gross Domestic Product (GDP) met expectations on Thursday, with Q1 GDP slightly revised to 1.4% from the initial print of 1.3%. Core Personal Consumption Expenditures in the first quarter also rose slightly, ticking up to 3.7% QoQ versus the forecast hold at 3.6%. Thursday’s upcoming Presidential debate, due to start after the day’s market close, will draw some attention as investors keep an eye out for possible policy hints from candidates.
Friday’s US PCE Price Index inflation print will be the week’s key data figure as investors hope for continued cooling in US inflation numbers to help push the Federal Reserve (Fed) closer toward rate cuts. At current cut, core PCE Price Index inflation is forecast to tick down to 0.1% MoM in May from 0.2%.
Economic Indicator
Core Personal Consumption Expenditures - Price Index (MoM)
The Core Personal Consumption Expenditures (PCE), released by the US Bureau of Economic Analysis on a monthly basis, measures the changes in the prices of goods and services purchased by consumers in the United States (US). The PCE Price Index is also the Federal Reserve’s (Fed) preferred gauge of inflation. The MoM figure compares the prices of goods in the reference month to the previous month.The core reading excludes the so-called more volatile food and energy components to give a more accurate measurement of price pressures. Generally, a high reading is bullish for the US Dollar (USD), while a low reading is bearish.
Read more.Next release: Fri Jun 28, 2024 12:30
Frequency: Monthly
Consensus: 0.1%
Previous: 0.2%
Source: US Bureau of Economic Analysis
After publishing the GDP report, the US Bureau of Economic Analysis releases the Personal Consumption Expenditures (PCE) Price Index data alongside the monthly changes in Personal Spending and Personal Income. FOMC policymakers use the annual Core PCE Price Index, which excludes volatile food and energy prices, as their primary gauge of inflation. A stronger-than-expected reading could help the USD outperform its rivals as it would hint at a possible hawkish shift in the Fed’s forward guidance and vice versa.
Dow Jones news
The Dow Jones is finding slim gains on Thursday after a firm surge in familiar favorites, but overall securities remain mixed. About half of the Dow Jones’ constituent securities are in the red for the day, with losses led by Merck & Co Inc. (MRK), which fell 2.25% to $128.55 per share and shed around three points on Thursday.
On the high side, Salesforce Inc. (CRM) soared around 6% to $256.82 per share as the company gears up for its latest shareholder meeting on Thursday.
Dow Jones technical outlook
The Dow Jones index shrugged off an early decline on Thursday, rallying to a thin gain into the 39,250.00 region. Still, bullish momentum remains tepid, and the major equity index is settling into a soft churn pattern in intraday trading.
Daily candlesticks are holding onto chart paper just north of the 50-day Exponential Moving Average (EMA) at 38,889.40, but topside momentum remains limited and bidders are running out of steam as the index trades south of recent all-time highs around the 40,000.00 major price handle.
Dow Jones five minute chart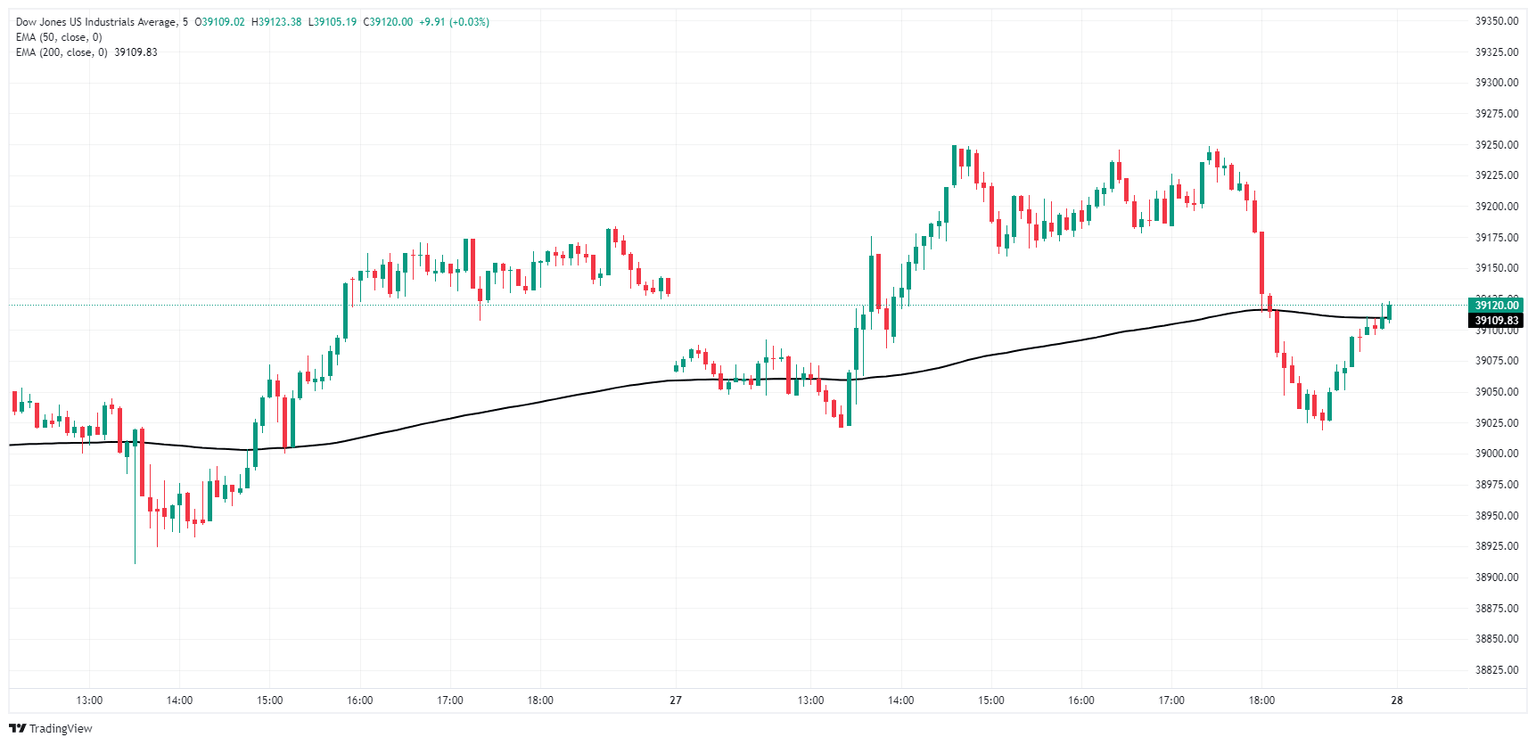
Dow Jones daily chart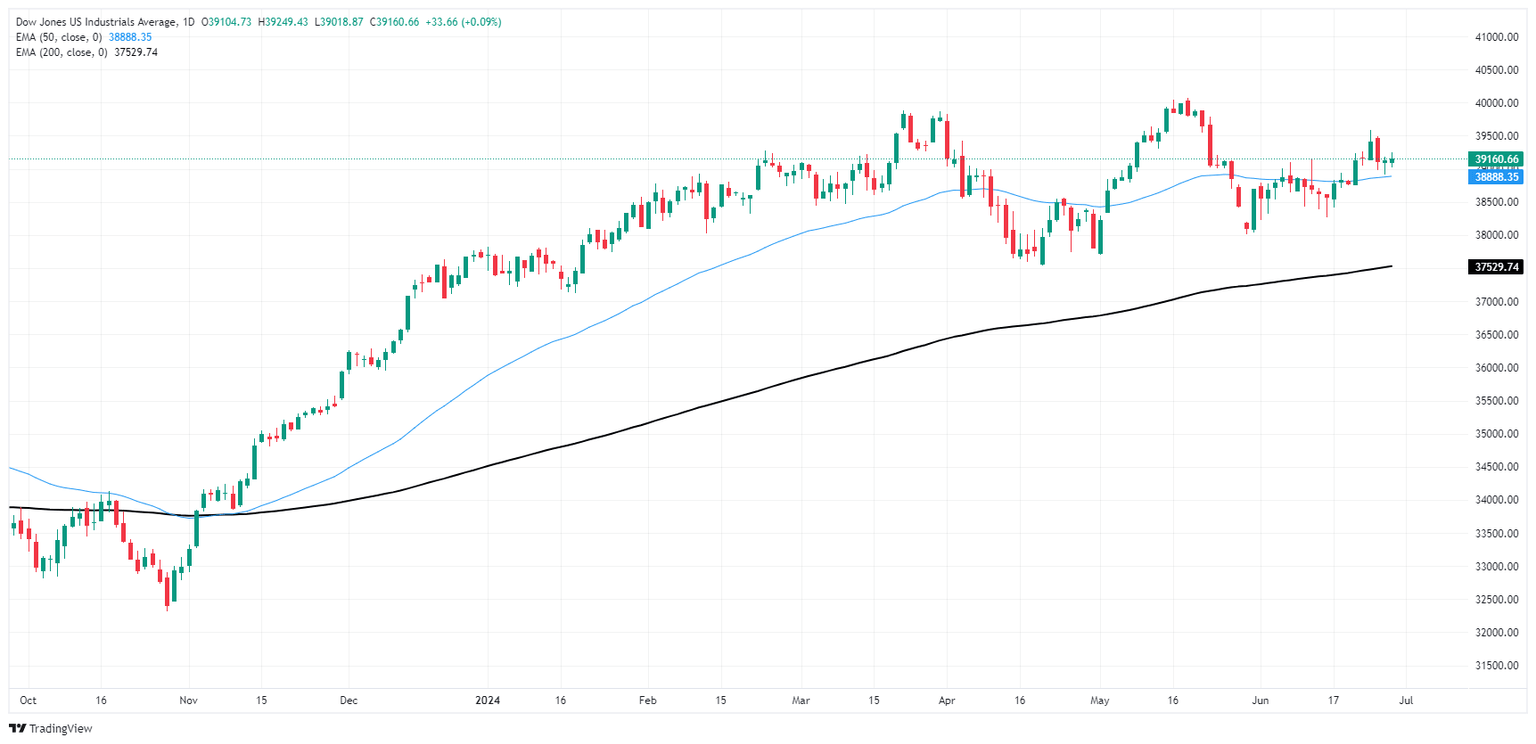
Dow Jones FAQs
The Dow Jones Industrial Average, one of the oldest stock market indices in the world, is compiled of the 30 most traded stocks in the US. The index is price-weighted rather than weighted by capitalization. It is calculated by summing the prices of the constituent stocks and dividing them by a factor, currently 0.152. The index was founded by Charles Dow, who also founded the Wall Street Journal. In later years it has been criticized for not being broadly representative enough because it only tracks 30 conglomerates, unlike broader indices such as the S&P 500.
Many different factors drive the Dow Jones Industrial Average (DJIA). The aggregate performance of the component companies revealed in quarterly company earnings reports is the main one. US and global macroeconomic data also contributes as it impacts on investor sentiment. The level of interest rates, set by the Federal Reserve (Fed), also influences the DJIA as it affects the cost of credit, on which many corporations are heavily reliant. Therefore, inflation can be a major driver as well as other metrics which impact the Fed decisions.
Dow Theory is a method for identifying the primary trend of the stock market developed by Charles Dow. A key step is to compare the direction of the Dow Jones Industrial Average (DJIA) and the Dow Jones Transportation Average (DJTA) and only follow trends where both are moving in the same direction. Volume is a confirmatory criteria. The theory uses elements of peak and trough analysis. Dow’s theory posits three trend phases: accumulation, when smart money starts buying or selling; public participation, when the wider public joins in; and distribution, when the smart money exits.
There are a number of ways to trade the DJIA. One is to use ETFs which allow investors to trade the DJIA as a single security, rather than having to buy shares in all 30 constituent companies. A leading example is the SPDR Dow Jones Industrial Average ETF (DIA). DJIA futures contracts enable traders to speculate on the future value of the index and Options provide the right, but not the obligation, to buy or sell the index at a predetermined price in the future. Mutual funds enable investors to buy a share of a diversified portfolio of DJIA stocks thus providing exposure to the overall index.
Author

Joshua Gibson
FXStreet
Joshua joins the FXStreet team as an Economics and Finance double major from Vancouver Island University with twelve years' experience as an independent trader focusing on technical analysis.


