Dow Jones Industrial Average turns negative and challenges 39,000
- Dow Jones gives away initial gains as investors digest Powell, US services data.
- US Services activity softened against expectations in March with the Prices Paid sub-index posting its lowest reading in years.
- Intel is leading losses in the Dow Jones after news of hefty losses in its foundry business.

The Dow Jones Industrial Average (DJIA) has returned to negative territory as Tuesday's session draws to a close. The soft US services activity data has offered some relief to investors, increasingly concerned that a string of strong US macroeconomic releases would force the Fed to dial down their monetary easing plans.
The US ISM Services PMI eased to 51.4 in March from 52.6 in February against market expectations of a slight increase to 52.7. Beyond that, the Prices Paid sub-index retreated to 53.4 from 58.6 in the previous month. This is the lowest reading in years and suggests a disinflationary contribution to the economy. These figures have offset the impact of strong ADP employment figures and the hawkish comments by Fed Chair Powel and Atlanta Fed President, Bostic.
All three main Wall Street Indexes have jumped after the release of the ISM Services PMI report. The NASDAQ is leading gains with a 0.5% advance to 16,319, followed by the S&P 500, up 0.3% to 5,223 and the Dow Jones is lagging with a 0.1% advance, trading at 39,220, still well below the 40,000 high hit last week.
Dow Jones news
The Industrials sector is the best performer with a 0.75% advance followed by materials, which adds 0.66% on Wednesday. On the losing end, only two of the eleven sectors are in the red with Consumer Staples losing 0.95% followed by the Utilities, down 0.1%.
Down to single stocks, the market is showing a more mixed picture. Intel (INTC) fell 7% to $40.78 hammered by a report stating that its foundry business recorded an operating loss of $7 billion in 2023.
Next is Procter & Gamble (PG), down 2.36% to $156.81, and Johnson & Johnson (JNJ), losing 1.6% to $155.19.
On the positive side, Caterpillar (CAT) advances 2.3% to $373.252, followed by Amazon (AMZN), which is 1.07% up at $182.63.
Dow Jones technical outlook
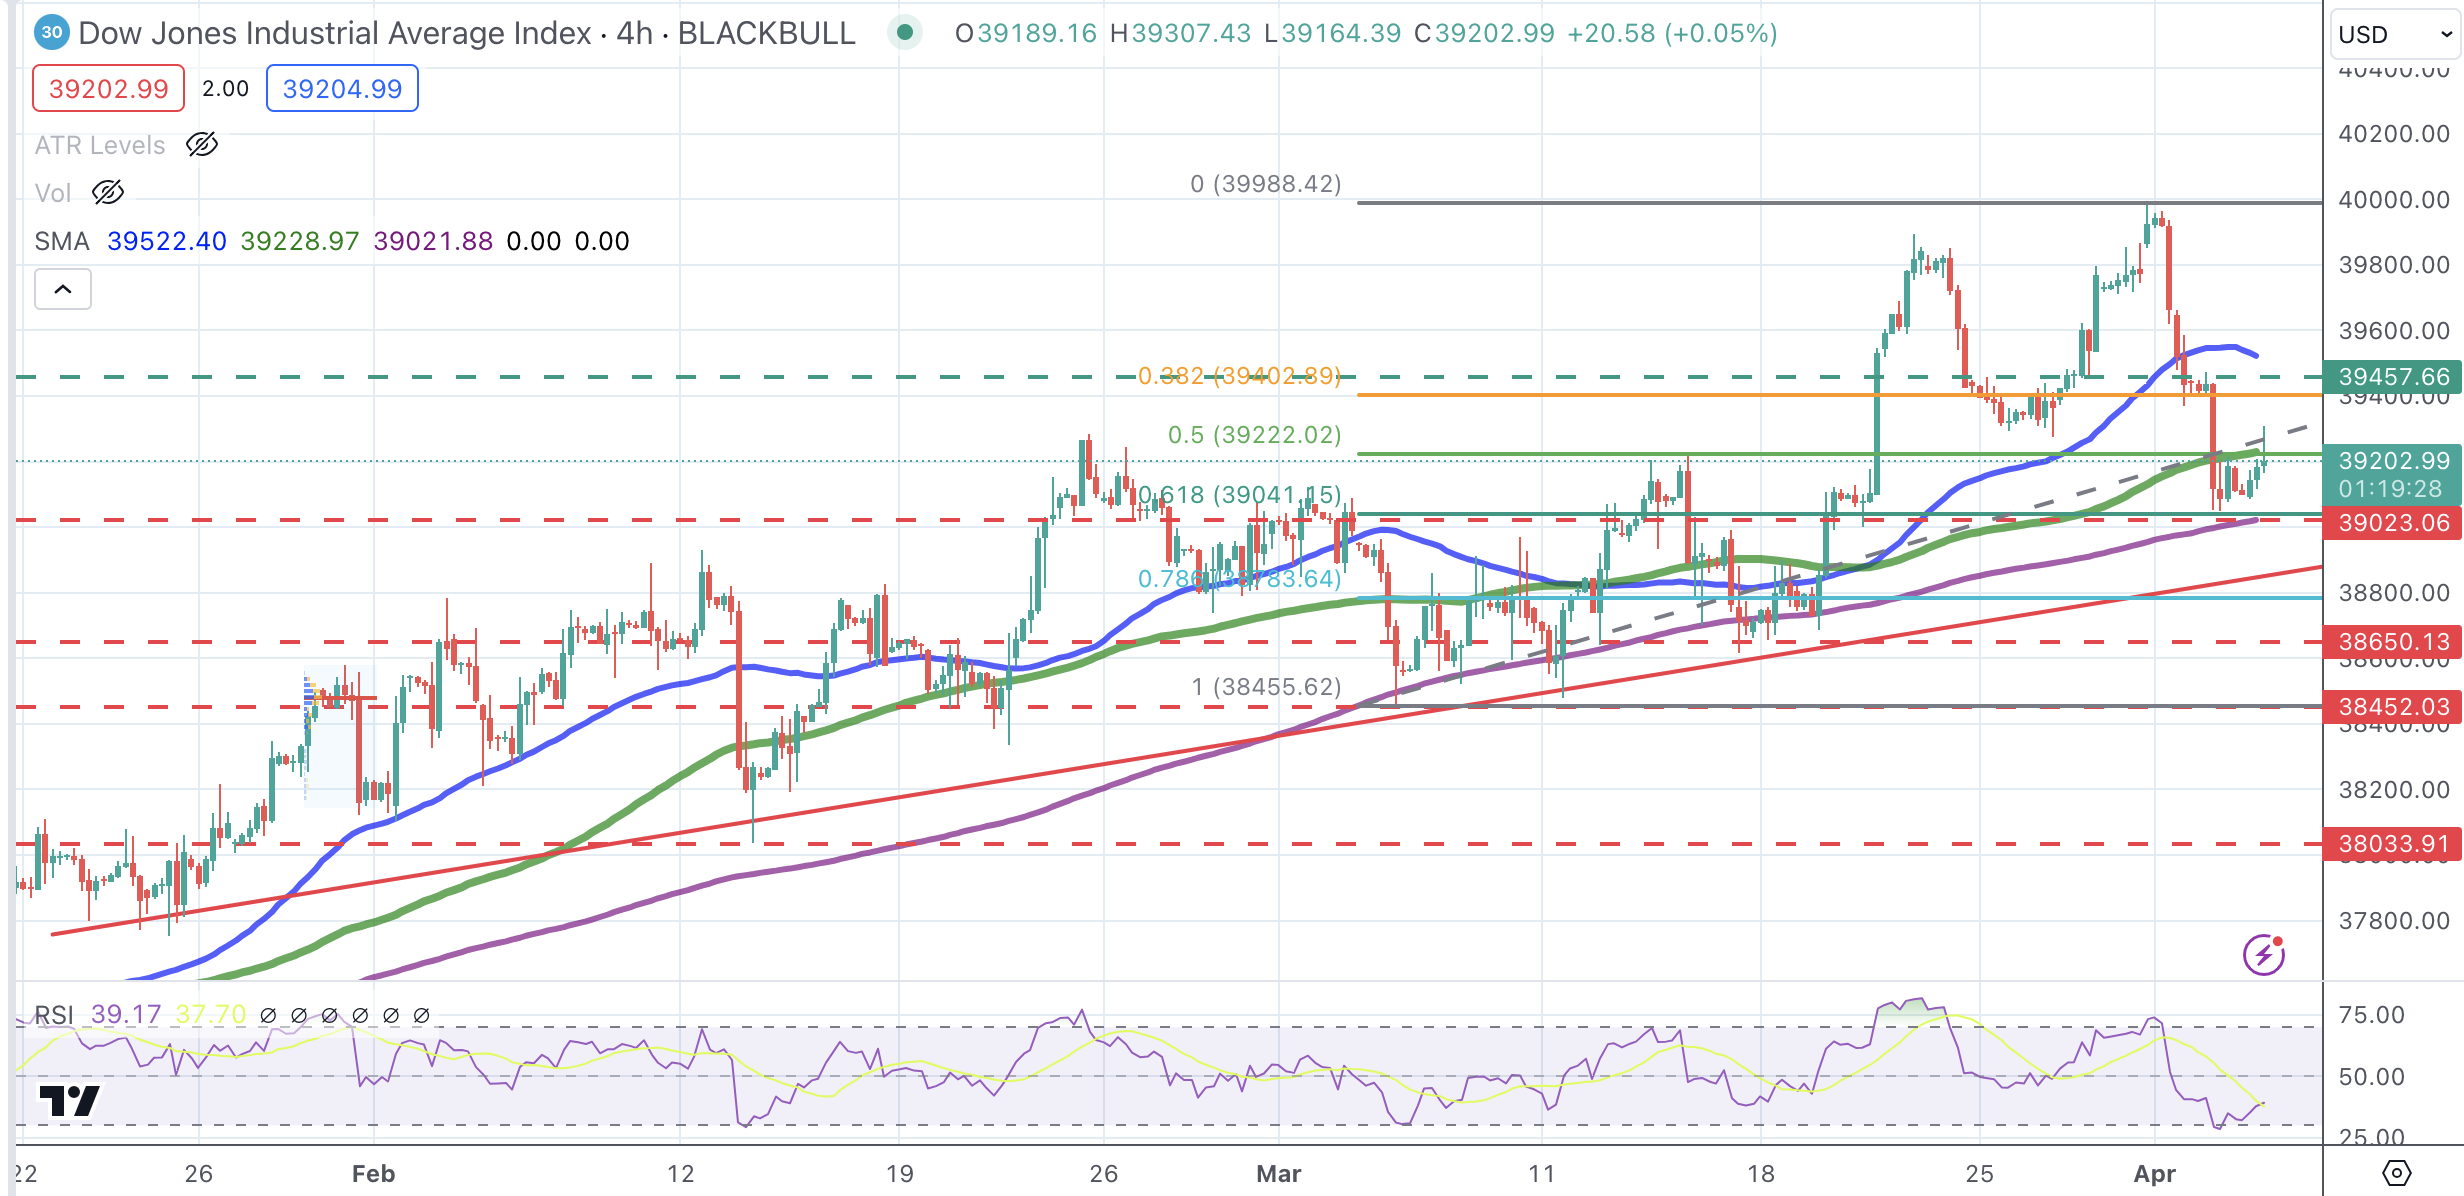
The technical picture is little changed from Tuesday, with the Dow Jones Index correcting lower, yet with the broader bullish trend still intact. Price Action remains contained between the 50% and the 61.8% Fibonacci retracement of the March rally, at 39,300, with bears in control after the rejection at the 40,000 psychological level last week.
The 39,000 support area is holding sellers for now and closing the path to the trendline support, now at 38,850. On the upside, the index is struggling to breach the mentioned 50% Fibonacci retracement at 39,195. Further up at 39,457 and the mentioned 40,000 would be the next targets.
Dow Jones 4-Hour Chart
Dow Jones FAQs
The Dow Jones Industrial Average, one of the oldest stock market indices in the world, is compiled of the 30 most traded stocks in the US. The index is price-weighted rather than weighted by capitalization. It is calculated by summing the prices of the constituent stocks and dividing them by a factor, currently 0.152. The index was founded by Charles Dow, who also founded the Wall Street Journal. In later years it has been criticized for not being broadly representative enough because it only tracks 30 conglomerates, unlike broader indices such as the S&P 500.
Many different factors drive the Dow Jones Industrial Average (DJIA). The aggregate performance of the component companies revealed in quarterly company earnings reports is the main one. US and global macroeconomic data also contributes as it impacts on investor sentiment. The level of interest rates, set by the Federal Reserve (Fed), also influences the DJIA as it affects the cost of credit, on which many corporations are heavily reliant. Therefore, inflation can be a major driver as well as other metrics which impact the Fed decisions.
Dow Theory is a method for identifying the primary trend of the stock market developed by Charles Dow. A key step is to compare the direction of the Dow Jones Industrial Average (DJIA) and the Dow Jones Transportation Average (DJTA) and only follow trends where both are moving in the same direction. Volume is a confirmatory criteria. The theory uses elements of peak and trough analysis. Dow’s theory posits three trend phases: accumulation, when smart money starts buying or selling; public participation, when the wider public joins in; and distribution, when the smart money exits.
There are a number of ways to trade the DJIA. One is to use ETFs which allow investors to trade the DJIA as a single security, rather than having to buy shares in all 30 constituent companies. A leading example is the SPDR Dow Jones Industrial Average ETF (DIA). DJIA futures contracts enable traders to speculate on the future value of the index and Options provide the right, but not the obligation, to buy or sell the index at a predetermined price in the future. Mutual funds enable investors to buy a share of a diversified portfolio of DJIA stocks thus providing exposure to the overall index.
Author

Guillermo Alcala
FXStreet
Graduated in Communication Sciences at the Universidad del Pais Vasco and Universiteit van Amsterdam, Guillermo has been working as financial news editor and copywriter in diverse Forex-related firms, like FXStreet and Kantox.


