Dow Jones Industrial Average plummets 500 points amid mixed PMIs and earnings misses
- The Dow Jones shed over 500 points in the midweek market session.
- Investors balked after US PMIs came in firmly mixed and key earnings missed.
- US Manufacturing set to slow further, but Services PMIs expanded.

The Dow Jones Industrial Average (DJIA) fell over 500 points on Wednesday after US Purchasing Managers Index (PMI) figures came in broadly mixed, entirely reversing course on forecasts. US equity markets pulled back, however rate markets still see 100% odds of a September rate cut from the Federal Reserve (Fed). Still, a lopsided economic data release will put additional pressure on upcoming calendar prints through the rest of the week.
July’s US Manufacturing PMI tumbled back into contraction territory for the first time since January, easing to 49.5 compared to the previous month’s 51.6 and flouting the forecast uptick to 51.7. Meanwhile, US Services PMI survey results surged to a 26-month high of 56.0 compared to the previous 55.3, and well above the forecast backslide to 54.4.
A mixed PMI print did little to support broad market sentiment, sending equities lower and investors bracing ahead of further key US data due this week. Thursday’s annualized Q2 Gross Domestic Product (GDP) is expected to rise to 2.0% from the previous 1.4%, while the QoQ GDP figure for Q2 is forecast to ease back to 2.6% from the previous 3.1%.
Friday’s Personal Consumption Expenditure Price Index (PCE) inflation will be the week’s critical data print. As the Fed’s preferred method of tracking inflation, a miss in core PCE Price Index could send investors heading for the hills or stepping further into risk-on bets on rate cut hopes. June’s YoY core PCE inflation is forecast to tick down slightly to 2.5% from 2.6%, with the MoM figure expected to hold steady at 0.1%.
Dow Jones news
Wide misses in earnings reports for key major stocks drove investors back in the back half of Wednesday's trading session, with steep declines in the Technology and Communication Services sectors.
Roughly two-thirds of the Dow Jones’ constituent securities were in the red on Wednesday, with losses being led through most of the day by Intel Inc. (INTC) which fell -3.8% to $31.70 per share. However, Visa Inc. (V) broke late to the downside, tumbling -4.0% on the day to $254.17 per share.
Dow Jones technical outlook
The Dow Jones is adding onto a recent pullback from all-time highs as the index slides back towards 40,000.00. The DJIA set a record peak bid of 41,371.38 last week, but the index is now trading down -3.5% in a brief pullback.
An extended pullback will see the Dow Jones challenging the 50-day Exponential Moving Average (EMA) at 39,472.52, with a long-term technical floor priced in at the 200-day EMA at 37,862.50.
Dow Jones daily chart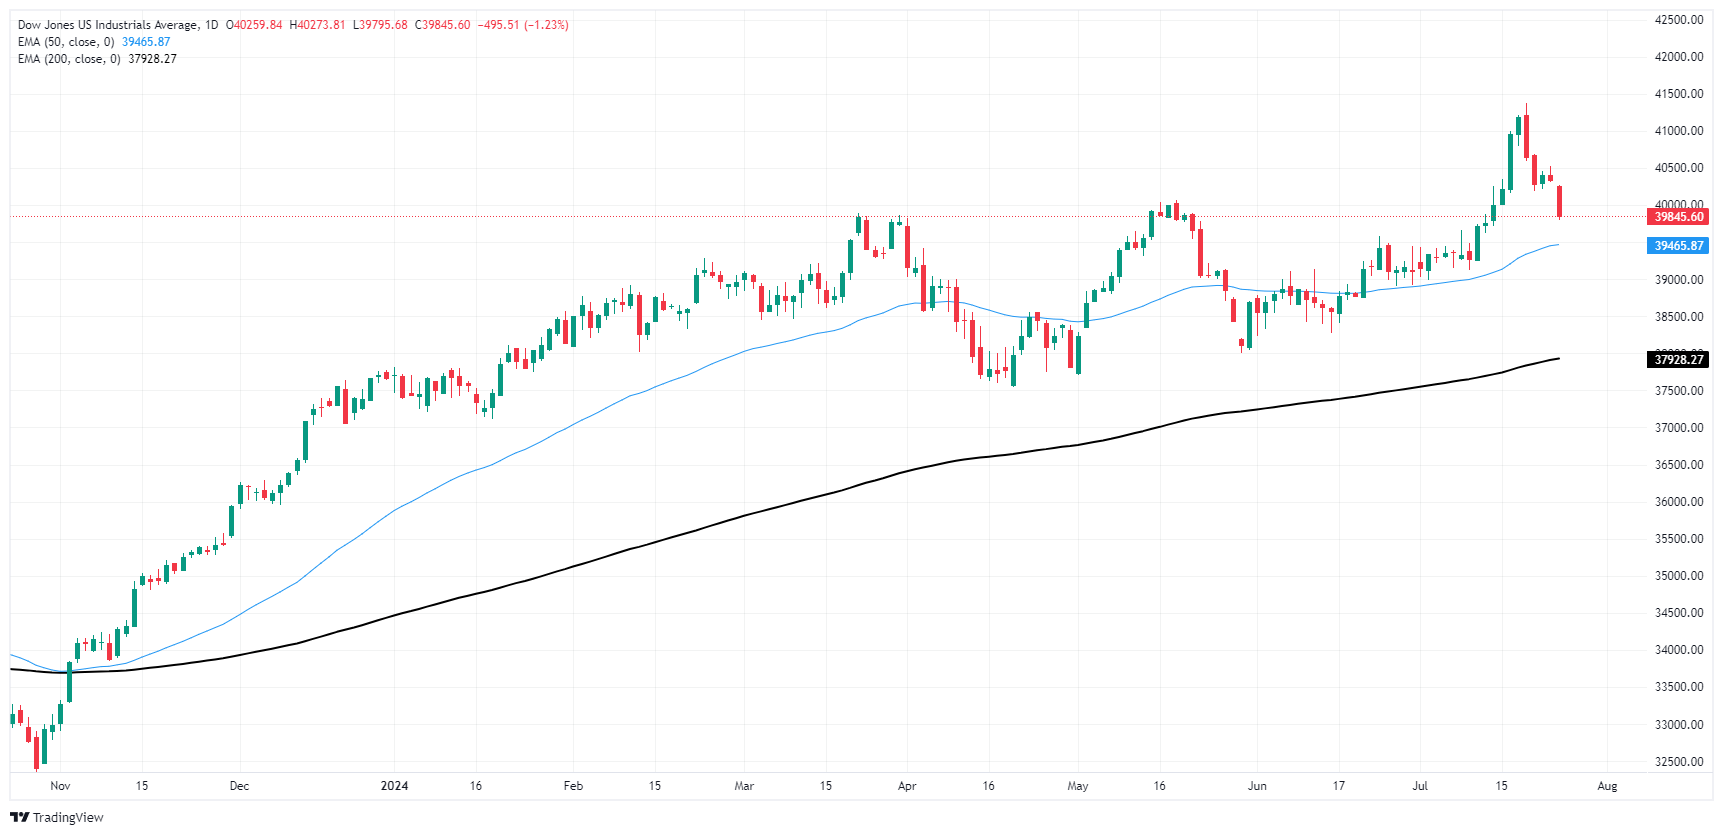
Dow Jones FAQs
The Dow Jones Industrial Average, one of the oldest stock market indices in the world, is compiled of the 30 most traded stocks in the US. The index is price-weighted rather than weighted by capitalization. It is calculated by summing the prices of the constituent stocks and dividing them by a factor, currently 0.152. The index was founded by Charles Dow, who also founded the Wall Street Journal. In later years it has been criticized for not being broadly representative enough because it only tracks 30 conglomerates, unlike broader indices such as the S&P 500.
Many different factors drive the Dow Jones Industrial Average (DJIA). The aggregate performance of the component companies revealed in quarterly company earnings reports is the main one. US and global macroeconomic data also contributes as it impacts on investor sentiment. The level of interest rates, set by the Federal Reserve (Fed), also influences the DJIA as it affects the cost of credit, on which many corporations are heavily reliant. Therefore, inflation can be a major driver as well as other metrics which impact the Fed decisions.
Dow Theory is a method for identifying the primary trend of the stock market developed by Charles Dow. A key step is to compare the direction of the Dow Jones Industrial Average (DJIA) and the Dow Jones Transportation Average (DJTA) and only follow trends where both are moving in the same direction. Volume is a confirmatory criteria. The theory uses elements of peak and trough analysis. Dow’s theory posits three trend phases: accumulation, when smart money starts buying or selling; public participation, when the wider public joins in; and distribution, when the smart money exits.
There are a number of ways to trade the DJIA. One is to use ETFs which allow investors to trade the DJIA as a single security, rather than having to buy shares in all 30 constituent companies. A leading example is the SPDR Dow Jones Industrial Average ETF (DIA). DJIA futures contracts enable traders to speculate on the future value of the index and Options provide the right, but not the obligation, to buy or sell the index at a predetermined price in the future. Mutual funds enable investors to buy a share of a diversified portfolio of DJIA stocks thus providing exposure to the overall index.
Author

Joshua Gibson
FXStreet
Joshua joins the FXStreet team as an Economics and Finance double major from Vancouver Island University with twelve years' experience as an independent trader focusing on technical analysis.


