Dow Jones Industrial Average sheds weight on risk-off Friday
- The Dow Jones lost 400 points on Friday.
- Holiday markets traded on the low side, Dow ended the week flat.
- Another midweek holiday next week will crimp market volumes.

The Dow Jones Industrial Average (DJIA) shed around 400 points on a quiet Friday. Most investors are still out of the markets on holidays and thin volumes have left the Dow Jones roughly a full percent lower.
Holiday market flows are in full swing in equities, with a broad-base cooling effect in the long-run tech rally as investors pull up stakes and do some light profit-taking ahead of the rollover into the new year. A thin data release schedule this week, followed by another midweek holiday next week, leaves equity indexes on the tepid side in the near term.
Traders are still grappling with the Federal Reserve’s (Fed) recent pivot into expectations of less rate cuts in 2025 than previously expected. According to the Fed’s latest Summary of Economic Projections (SEP), policymakers only expect another two quarter-point rate cuts through next year, hobbling market expectations for a steeper decline in the headline reference rate.
Dow Jones news
Despite an overall blustery year that saw the Down Jones climb nearly 21.5% bottom-to-top, the major equity index still got coal in its stocking as December turns deeper into the red and pares away November’s heady gains. All but five of the Dow’s listed securities are testing into the red on Friday, with losses led by Nvidia (NVDA), which fell over 2% and is back below $137 per share.
Nvidia appears to have shrugged off recent reports that its latest Blackwell AI-focused chipset may have experienced an overheating problem, but fresh woes for the AI-fueled tech rally have cropped up as investors weigh the prospect of stiffer restrictions on Chinese access to US-manufactured silicon solutions. An outsized amount of Chinese demand for recently-developed AI-focused chipsets could leave profit expectations for Nvidia in the lurch if regulations hamper trade.
Dow Jones price forecast
The Dow Jones’ stellar 2024 run appears to be taking a breather after declining for three consecutive weeks. The DJIA is down nearly 5% from record highs above 45,000, testing the waters just south of the 43,000 handle.
The Dow Jones has fallen below its 50-day Exponential Moving Average (EMA) near 43,345 for the second time in as many months, but price action is still holding well above the 200-day EMA near 40,960 after bids found a technical floor near 42,000.
Dow Jones daily chart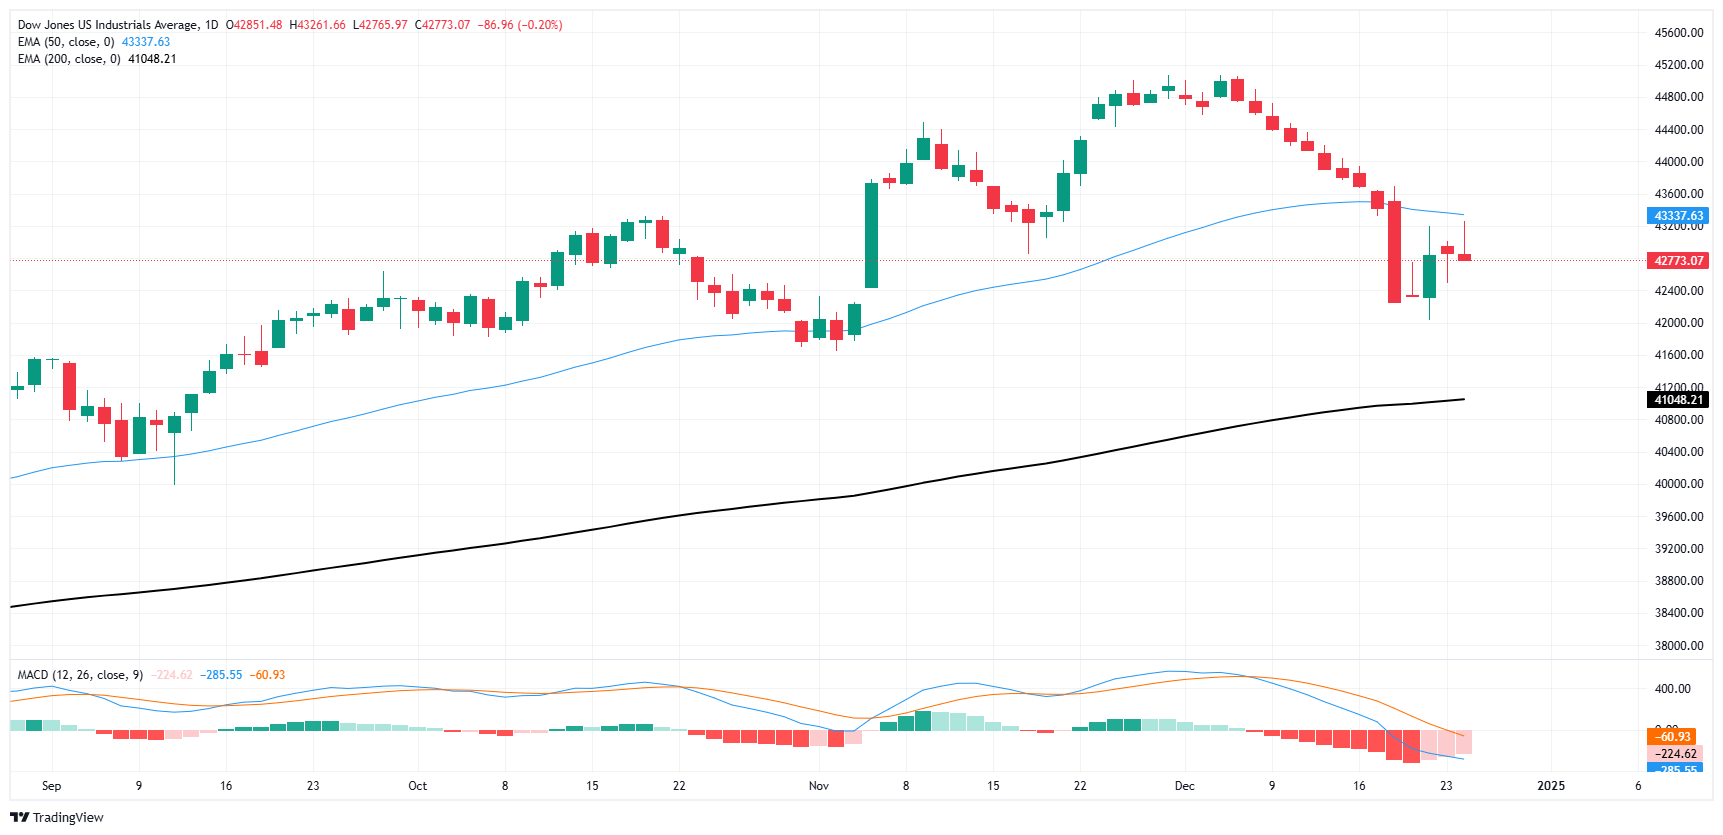
Dow Jones FAQs
The Dow Jones Industrial Average, one of the oldest stock market indices in the world, is compiled of the 30 most traded stocks in the US. The index is price-weighted rather than weighted by capitalization. It is calculated by summing the prices of the constituent stocks and dividing them by a factor, currently 0.152. The index was founded by Charles Dow, who also founded the Wall Street Journal. In later years it has been criticized for not being broadly representative enough because it only tracks 30 conglomerates, unlike broader indices such as the S&P 500.
Many different factors drive the Dow Jones Industrial Average (DJIA). The aggregate performance of the component companies revealed in quarterly company earnings reports is the main one. US and global macroeconomic data also contributes as it impacts on investor sentiment. The level of interest rates, set by the Federal Reserve (Fed), also influences the DJIA as it affects the cost of credit, on which many corporations are heavily reliant. Therefore, inflation can be a major driver as well as other metrics which impact the Fed decisions.
Dow Theory is a method for identifying the primary trend of the stock market developed by Charles Dow. A key step is to compare the direction of the Dow Jones Industrial Average (DJIA) and the Dow Jones Transportation Average (DJTA) and only follow trends where both are moving in the same direction. Volume is a confirmatory criteria. The theory uses elements of peak and trough analysis. Dow’s theory posits three trend phases: accumulation, when smart money starts buying or selling; public participation, when the wider public joins in; and distribution, when the smart money exits.
There are a number of ways to trade the DJIA. One is to use ETFs which allow investors to trade the DJIA as a single security, rather than having to buy shares in all 30 constituent companies. A leading example is the SPDR Dow Jones Industrial Average ETF (DIA). DJIA futures contracts enable traders to speculate on the future value of the index and Options provide the right, but not the obligation, to buy or sell the index at a predetermined price in the future. Mutual funds enable investors to buy a share of a diversified portfolio of DJIA stocks thus providing exposure to the overall index.
Author

Joshua Gibson
FXStreet
Joshua joins the FXStreet team as an Economics and Finance double major from Vancouver Island University with twelve years' experience as an independent trader focusing on technical analysis.