Crude Oil extends recovery on renewed supply hopes, WTI breaches $77.50
- WTI added $2.50 per barrel on Monday as energy markets pile back in.
- Crude Oil markets are hoping for a surge in summer gasoline demand.
- Fresh week-on-week barrel counts from API and EIA will be watched closely.

West Texas Intermediate (WTI) US Crude Oil continued a determined recovery to kick off the trading week, with WTI bids crossing $77.50 per barrel and setting a fresh June high as energy traders pile back into fresh bullish bets of a flood of demand sopping up oversupplied Crude Oil markets.
Crude Oil markets tumbled into fresh multi-month lows in recent weeks after the Organization of the Petroleum Exporting Countries (OPEC) announced a phasing out of voluntary production caps for its extended network of non-member ally states, OPEC+. OPEC and its consortium have been limiting output through 2023 and 2024 in an effort to stem the tide of global overcapacity, but crimped output limits have been hitting OPEC+ nations in their government budgets, which rely on Crude Oil sales to balance their books.
The planned phasing out of OPEC+ caps in conjunction with an expected uptick in gasoline demand that has failed to materialize at several junctures has left Crude Oil markets battered. Energy traders are seeing renewed hopes of an uptick in fossil fuel usage as the US heads into the summer months on the back of summertime driving season and increased cooling demand.
Crude Oil traders will also be on the lookout for updated barrel counts this week from the American Petroleum Institute (API) and the Energy Information Administration (EIA), both of which noted another upswing in raw barrel supply counts. The API dishes out their latest Weekly Crude Oil Stocks for the week ended July 7 on Tuesday, followed by the EIA’s Crude Oil Stocks Change for the same period on Wednesday.
Economic Indicator
API Weekly Crude Oil Stock
API’s Weekly Statistical Bulletin (WSB) has reported total U.S. and regional data relating to refinery operations and the production of the four major petroleum products: motor gasoline, kerosene jet fuel, distillate (by sulfur content), and residual fuel oil. These products represent more than 85% of total petroleum industry.
Read more.Next release: Tue Jun 11, 2024 20:30
Frequency: Weekly
Consensus: -
Previous: 4.052M
Source: American Petroleum Institute
Economic Indicator
EIA Crude Oil Stocks Change
The EIA Crude Oil stockpiles report is a weekly measure of the change in the number of barrels in stock of crude oil and its derivates, and it's released by the Energy Information Administration. This report tends to generate large price volatility, as oil prices impact on worldwide economies, affecting the most, commodity related currencies such as the Canadian dollar. Despite it has a limited impact among currencies, this report tends to affect the price of oil itself, and, therefore, had a more notorious impact on WTI crude futures.
Read more.Next release: Wed Jun 12, 2024 14:30
Frequency: Weekly
Consensus: -
Previous: 1.233M
WTI technical outlook
US Crude Oil is up over 3% on Monday, seeing its best single-day performance since early January as WTI bids cross back over $77.50 per barrel. Price action still remains on the low side of the 200-day Exponential Moving Average (EMA) at $78.76, but remains up 8.6% in 2024.
Bidders might run out of gas quickly as WTI retraces into a near-term congestion zone above $76.50, and a leg lower could be on the cards if sellers return before prices recover the key $80.00 per barrel technical handle.
WTI hourly chart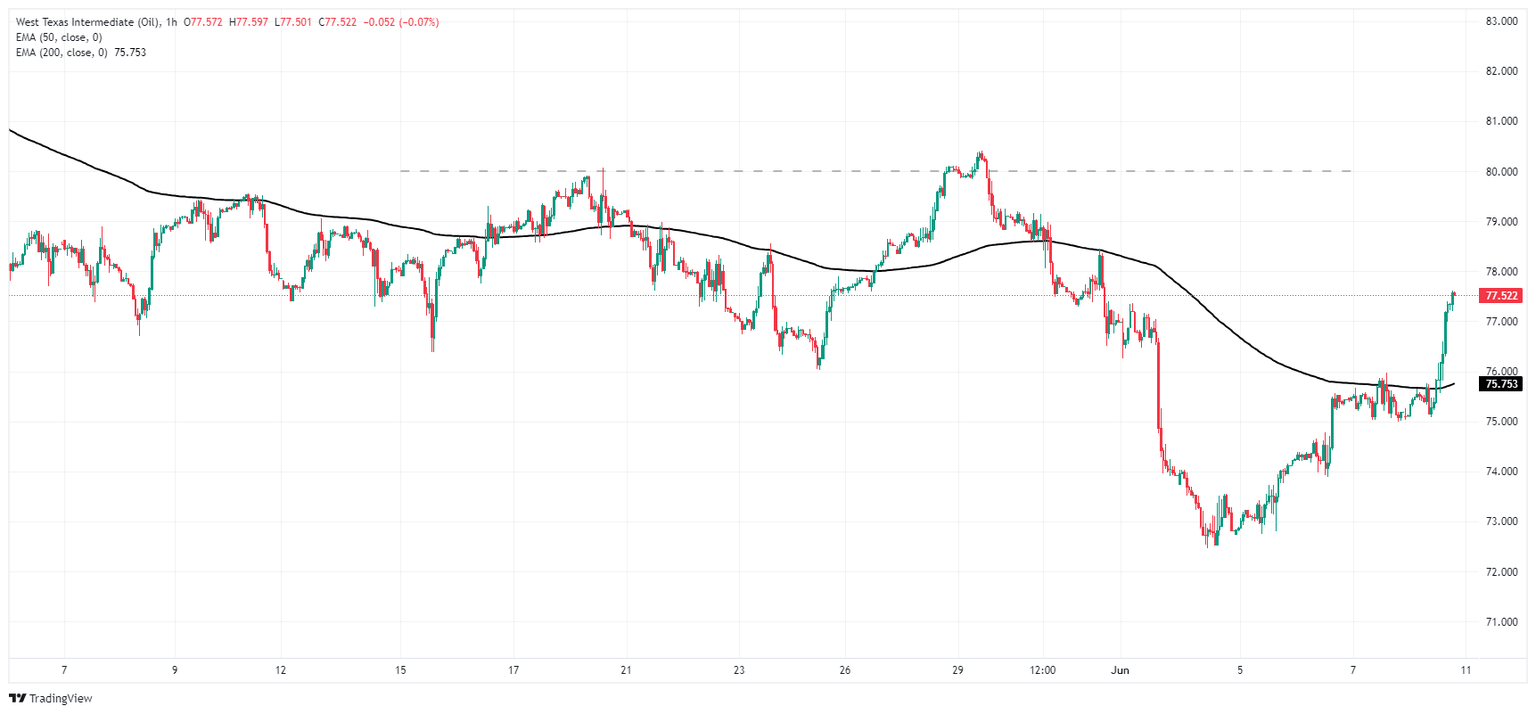
WTI daily chart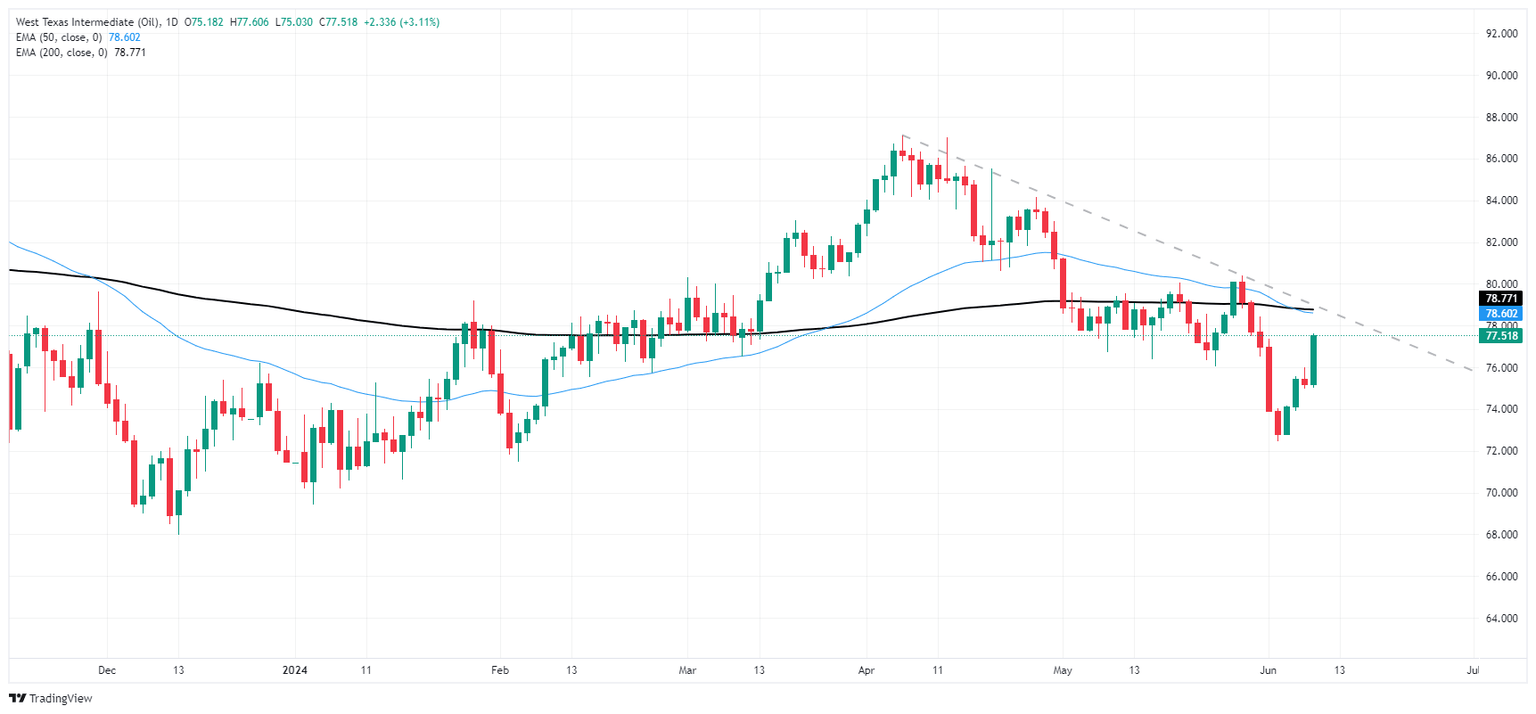
Author

Joshua Gibson
FXStreet
Joshua joins the FXStreet team as an Economics and Finance double major from Vancouver Island University with twelve years' experience as an independent trader focusing on technical analysis.


