Crude Oil eases back after rise on geopolitical concerns, WTI falls back into $72.50
- WTI rose on Friday after markets were gripped once more by geopolitical concerns.
- Chinese Crude Oil demand recovered on Friday, further boosting the day’s bids.
- Oil markets settled back into familiar lows as the trading week drew to a close.

West Texas Intermediate (WTI) US Crude Oil rose to a new 2024 high of $75.27 on Friday, with energy markets growing increasingly nervous about spill-over from ongoing geopolitical tensions after naval forces from the US and UK launched attacks on Houthi rebel forces that have been targeting civilian cargo and tanker ships off the coast of Yemen. Houthi attacks on ships bound for the Suez Canal have gripped oil markets in recent weeks as supply chains connecting Europe and the Middle East see shipping lanes diverted around the African continent.
Chinese demand for Crude Oil set a record high in 2023, easing market concerns about declining fossil fuel demand from China, who is grappling with a slowing economy and lopsided growth.
Crude Oil markets surged on combined headlines, driving WTI briefly above $75.00 before US Producer Price Index (PPI) figures missed market expectations. Markets broadly pivoted into renewed expectations of Federal Reserve (Fed) rate hikes before global markets settled back, dragging Crude Oil lower once more. WTI settled back below $73.00 per barrel as investors take stock and gear up for another weekend thick with geopolitical headlines.
WTI Technical Levels
Friday saw WTI US Crude Oil attempt a run higher before getting knocked back towards near-term median bids, climbing to WTI’s highest bids since late December before slipping back into familiar consolidation that has plagued Crude Oil since a tumble late in Q3 2023.
Near-term price action remains constrained close to the 200-hour Simple Moving Average (SMA) near $72.50, with an immediate technical floor priced in at the last swing low just above $71.00.
Upside momentum in WTI remains capped by a declining 50-day SMA falling into $74.00, with long-term price action on the south side of the 200-day SMA near $78.00.
WTI Hourly Chart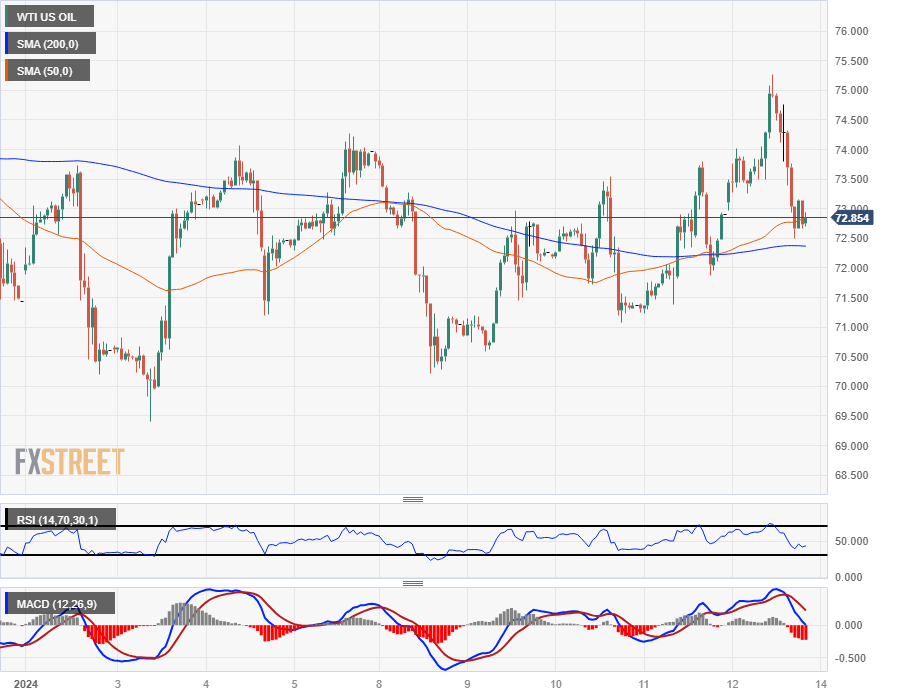
WTI Daily Chart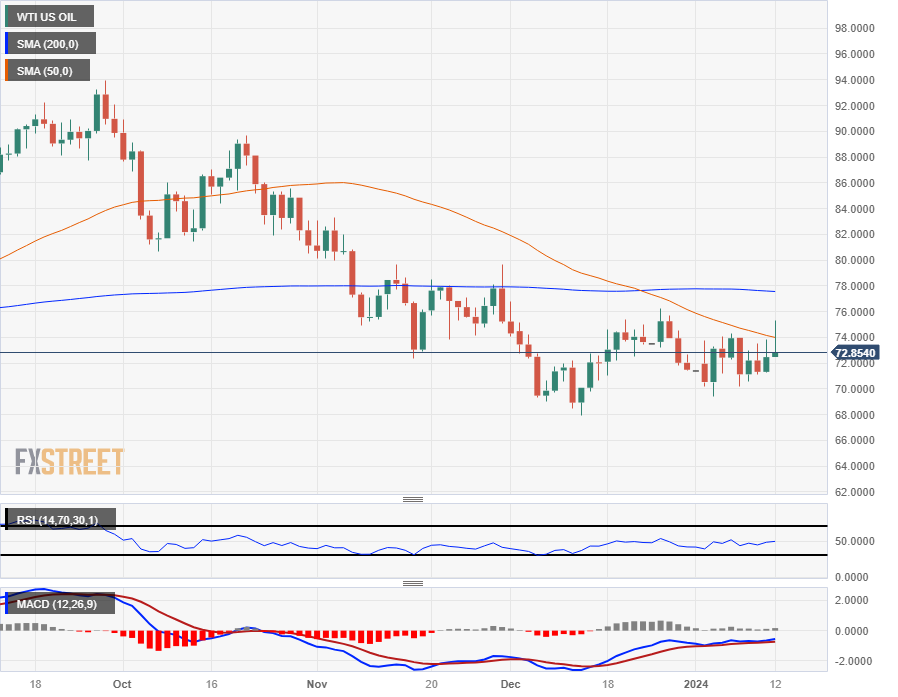
WTI Technical Levels
Author

Joshua Gibson
FXStreet
Joshua joins the FXStreet team as an Economics and Finance double major from Vancouver Island University with twelve years' experience as an independent trader focusing on technical analysis.


