Crude Oil declines on Monday, WTI faces familiar technical levels as tropical storm fears ease
- Crude Oil markets chilled on Monday, easing lower as odds of supply constraints drop.
- Fears of supply chain disruptions from Tropical Storm Beryl eased after storm downgrade.
- Barrel traders will be looking for a continuation of last week’s supply declines to bolster prices.

West Texas Intermediate (WTI) eased lower on Monday, bleeding bids as broad-market fears of supply disruptions from Tropical Storm Beryl have receded. The tropical storm, which initially made landfall in Texas as a category 1 hurricane, has been downgraded after wind speeds declined, and looks set to peter out without disrupting US domestic Crude Oil markets.
A risk bid from possible supply chain disruptions from Beryl helped to bolster Crude Oil prices last week. However, Monday’s updates to the storm’s projected dissipation has pulled technical support from beneath Crude bids, extending Friday’s declines and sending WTI down to $81.60.
Crude Oil markets will be looking for a continuation of last week’s sharp supply drawdown after both the American Petroleum Institute (API) and the Energy Information Administration (EIA) both post huge week-on-week contractions in US Crude Oil supplies. Energy investors will be looking for a repeat this week when the API reports Weekly Crude Oil Stocks on Tuesday, followed by EIA barrel counts on Wednesday.
Global energy markets continue to keep Crude Oil prices bid on long-running hopes of a broad uptick in fossil fuel demand, but after a half-year of flubbed sparks in demand upticks, analysts are beginning to express skepticism about the accuracy of demand growth projections from the Organization of the Petroleum Exporting Countries (OPEC). Global Crude Oil demand forecasts were initially built upon a foundation of easing global interest rates, a trend that has failed to materialize through 2024.
WTI technical outlook
WTI US Crude Oil has eased back below the 200-hour Exponential Moving Average (EMA) at $82.14, testing close to a familiar technical inflection point at $81.50. WTI flubbed a bullish push into fresh near-term highs last week, falling just short of reclaiming the $84.00 handle and easing back into recent technical levels.
Daily candlesticks are set to finish an unceremonious end to a recent bullish break north of a near-term congestion zone. An extended backslide will see WTI bids challenging the 200-day EMA at $79.29 once more.
WTI hourly chart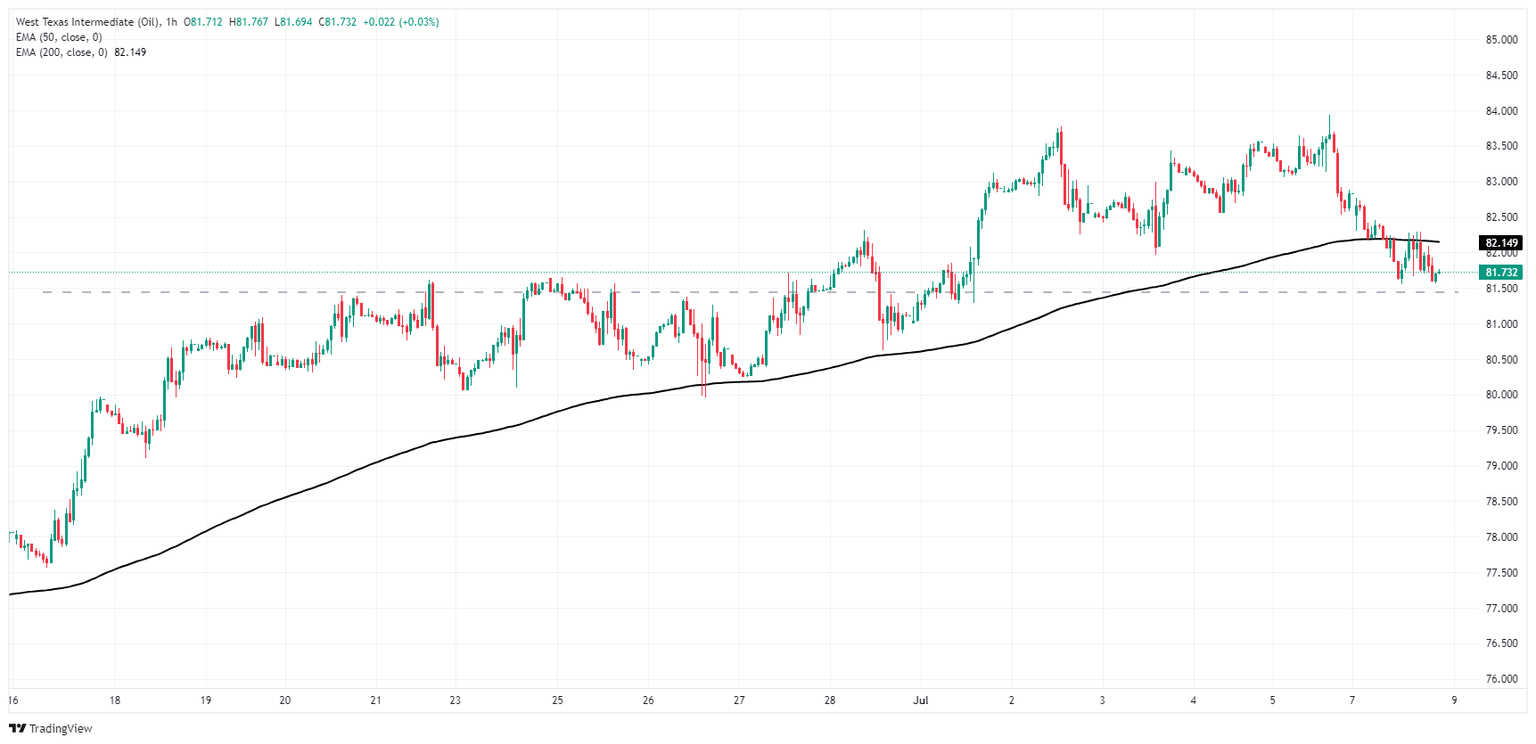
WTI daily chart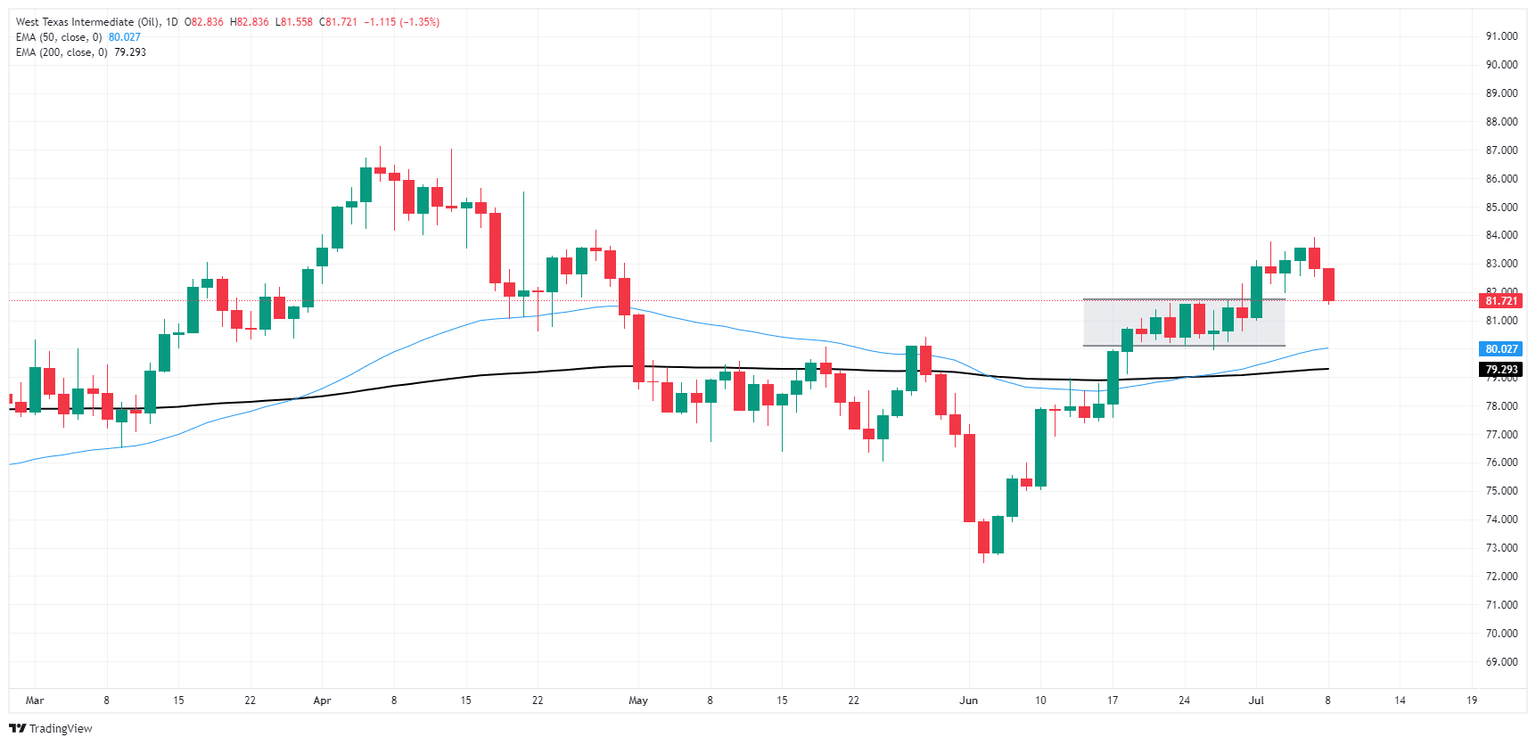
WTI Oil FAQs
WTI Oil is a type of Crude Oil sold on international markets. The WTI stands for West Texas Intermediate, one of three major types including Brent and Dubai Crude. WTI is also referred to as “light” and “sweet” because of its relatively low gravity and sulfur content respectively. It is considered a high quality Oil that is easily refined. It is sourced in the United States and distributed via the Cushing hub, which is considered “The Pipeline Crossroads of the World”. It is a benchmark for the Oil market and WTI price is frequently quoted in the media.
Like all assets, supply and demand are the key drivers of WTI Oil price. As such, global growth can be a driver of increased demand and vice versa for weak global growth. Political instability, wars, and sanctions can disrupt supply and impact prices. The decisions of OPEC, a group of major Oil-producing countries, is another key driver of price. The value of the US Dollar influences the price of WTI Crude Oil, since Oil is predominantly traded in US Dollars, thus a weaker US Dollar can make Oil more affordable and vice versa.
The weekly Oil inventory reports published by the American Petroleum Institute (API) and the Energy Information Agency (EIA) impact the price of WTI Oil. Changes in inventories reflect fluctuating supply and demand. If the data shows a drop in inventories it can indicate increased demand, pushing up Oil price. Higher inventories can reflect increased supply, pushing down prices. API’s report is published every Tuesday and EIA’s the day after. Their results are usually similar, falling within 1% of each other 75% of the time. The EIA data is considered more reliable, since it is a government agency.
OPEC (Organization of the Petroleum Exporting Countries) is a group of 13 Oil-producing nations who collectively decide production quotas for member countries at twice-yearly meetings. Their decisions often impact WTI Oil prices. When OPEC decides to lower quotas, it can tighten supply, pushing up Oil prices. When OPEC increases production, it has the opposite effect. OPEC+ refers to an expanded group that includes ten extra non-OPEC members, the most notable of which is Russia.
Author

Joshua Gibson
FXStreet
Joshua joins the FXStreet team as an Economics and Finance double major from Vancouver Island University with twelve years' experience as an independent trader focusing on technical analysis.


