Canadian Dollar slightly down against US Dollar on Wednesday after US GDP beats the street
- Canadian Dollar is seeing mixed results but drops against US Dollar on Wednesday.
- Canada Current Account posts smaller rebound than expected.
- US GDP outpaces expectations, weighing on Tuesday’s Fed pivot expectations.

The Canadian Dollar (CAD) mixed against the other major currencies on Wednesday and drifted into the midrange against the US Dollar (USD). The Loonie climbed nearly a third of a percent against the US Dollar on Wednesday before paring back into the day's opening bids and sliding back a further two-tenths of a percent.
Canada’s trade balance rebounded in the third quarter but still missed expectations with the Canadian Current Account printing a CAD $-3.22 billion decline. The second quarter’s print was revised even lower to $-7.32 billion.
Daily Digest Market Movers: Canadian Dollar draws back against Greenback as markets twist
- Canadian Current Account was expected to post a billion CAD gain but shrunk by an additional $3.22 billion on Wednesday.
- The previous print also got revised lower from $-6.63 billion, steepening the CAD’s trade imbalance.
- US Gross Domestic Product (GDP) growth beat the market to post an accelerated 5.2% for the third quarter, beating the forecast for 5.0% and the second quarter’s 4.9% growth.
- US Personal Consumption Expenditure (PCE) Prices for the third quarter missed expectations, and mixed data results are clouding the USD’s outlook.
- PCE Prices ticked lower to 2.8%, markets were expecting a hold at the second quarter’s print of 2.9%.
- Fedspeak is back on the offering on Wednesday after Tuesday’s comments sparked a broad-market bid.
- The President of the Federal Reserve (Fed) Bank of Richmond hit newswires in the US market session, striking a notably more hawkish tone than Fed Governor Christopher Wallace on Tuesday.
- President Barkin remains skeptical that 2% inflation can be achieved from here without additional tightening or at least maintaining the Fed’s “higher for longer” stance.
Canadian Dollar price today
The table below shows the percentage change of Canadian Dollar (CAD) against listed major currencies today. Canadian Dollar was the weakest against the Swiss Franc.
| USD | EUR | GBP | CAD | AUD | JPY | NZD | CHF | |
| USD | 0.29% | 0.14% | 0.22% | 0.66% | 0.18% | -0.07% | -0.38% | |
| EUR | -0.28% | -0.13% | -0.06% | 0.37% | -0.10% | -0.36% | -0.66% | |
| GBP | -0.15% | 0.13% | 0.07% | 0.50% | 0.02% | -0.25% | -0.52% | |
| CAD | -0.22% | 0.07% | -0.07% | 0.44% | -0.05% | -0.30% | -0.60% | |
| AUD | -0.67% | -0.39% | -0.52% | -0.47% | -0.49% | -0.73% | -1.04% | |
| JPY | -0.18% | 0.11% | -0.02% | 0.04% | 0.51% | -0.24% | -0.54% | |
| NZD | 0.10% | 0.35% | 0.21% | 0.29% | 0.73% | 0.20% | -0.33% | |
| CHF | 0.36% | 0.64% | 0.51% | 0.60% | 1.03% | 0.53% | 0.31% |
The heat map shows percentage changes of major currencies against each other. The base currency is picked from the left column, while the quote currency is picked from the top row. For example, if you pick the Euro from the left column and move along the horizontal line to the Japanese Yen, the percentage change displayed in the box will represent EUR (base)/JPY (quote).
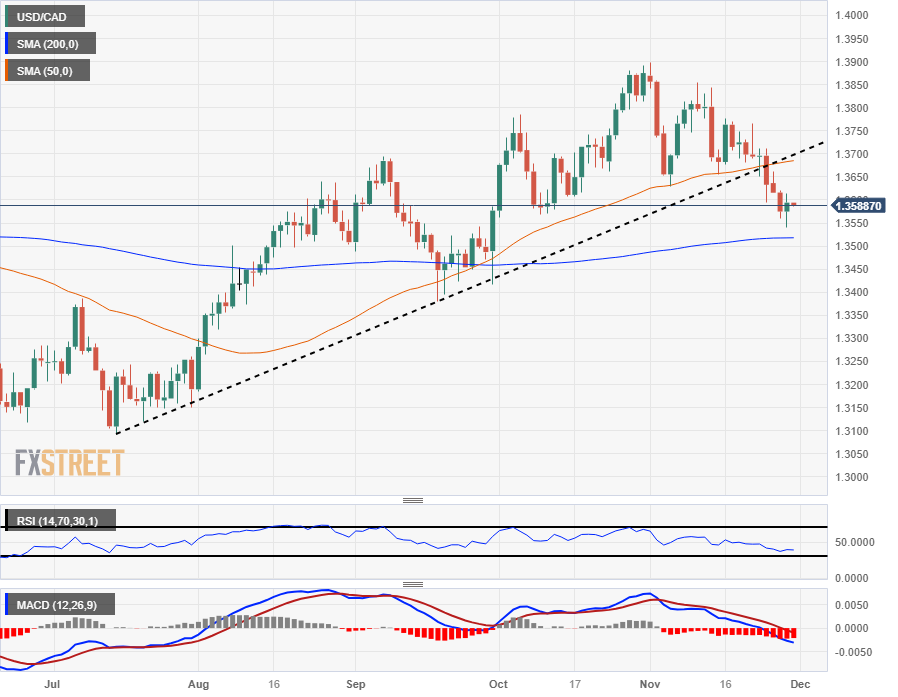
Technical Analysis: Canadian Dollar falls back against Greenback, USD/CAD claws back recent losses, looks to price in floor from 1.3550
The Canadian Dollar (CAD) is paring away Wednesday's gains against the US Dollar (USD), sending the USD/CAD back a third of a percent from Wednesday’s low bids near 1.3550. Intraday action is seeing congestion near the 1.3600 handle for the day.
The USD/CAD still has some room to fall before coming into contact with the 200-day Simple Moving Average (SMA) near 1.3520, but an extended rebound will see a technical ceiling from the 50-day SMA just below 1.3700.
The pair is still seeing some pull from the rising trendline drawn from July’s lows near 1.3100, and the USD/CAD’s recent decline through the technical barrier sees the Loonie beginning to run out of bearish chart space with technical indicators leaning toward the oversold side.
The Relative Strength Index (RSI) is approaching oversold conditions, while the Moving Average Convergence-Divergence (MACD) indicator has the fast signal line declining below the midline, a sign that selling pressure could run out of steam in the near future.
USD/CAD Daily Chart
Canadian Dollar FAQs
What key factors drive the Canadian Dollar?
The key factors driving the Canadian Dollar (CAD) are the level of interest rates set by the Bank of Canada (BoC), the price of Oil, Canada’s largest export, the health of its economy, inflation and the Trade Balance, which is the difference between the value of Canada’s exports versus its imports. Other factors include market sentiment – whether investors are taking on more risky assets (risk-on) or seeking safe-havens (risk-off) – with risk-on being CAD-positive. As its largest trading partner, the health of the US economy is also a key factor influencing the Canadian Dollar.
How do the decisions of the Bank of Canada impact the Canadian Dollar?
The Bank of Canada (BoC) has a significant influence on the Canadian Dollar by setting the level of interest rates that banks can lend to one another. This influences the level of interest rates for everyone. The main goal of the BoC is to maintain inflation at 1-3% by adjusting interest rates up or down. Relatively higher interest rates tend to be positive for the CAD. The Bank of Canada can also use quantitative easing and tightening to influence credit conditions, with the former CAD-negative and the latter CAD-positive.
How does the price of Oil impact the Canadian Dollar?
The price of Oil is a key factor impacting the value of the Canadian Dollar. Petroleum is Canada’s biggest export, so Oil price tends to have an immediate impact on the CAD value. Generally, if Oil price rises CAD also goes up, as aggregate demand for the currency increases. The opposite is the case if the price of Oil falls. Higher Oil prices also tend to result in a greater likelihood of a positive Trade Balance, which is also supportive of the CAD.
How does inflation data impact the value of the Canadian Dollar?
While inflation had always traditionally been thought of as a negative factor for a currency since it lowers the value of money, the opposite has actually been the case in modern times with the relaxation of cross-border capital controls. Higher inflation tends to lead central banks to put up interest rates which attracts more capital inflows from global investors seeking a lucrative place to keep their money. This increases demand for the local currency, which in Canada’s case is the Canadian Dollar.
How does economic data influence the value of the Canadian Dollar?
Macroeconomic data releases gauge the health of the economy and can have an impact on the Canadian Dollar. Indicators such as GDP, Manufacturing and Services PMIs, employment, and consumer sentiment surveys can all influence the direction of the CAD. A strong economy is good for the Canadian Dollar. Not only does it attract more foreign investment but it may encourage the Bank of Canada to put up interest rates, leading to a stronger currency. If economic data is weak, however, the CAD is likely to fall.
Author

Joshua Gibson
FXStreet
Joshua joins the FXStreet team as an Economics and Finance double major from Vancouver Island University with twelve years' experience as an independent trader focusing on technical analysis.


