Canadian Dollar grinds out a limited recovery after BoC Macklem
- Canadian Dollar halts the slide but fails to recover ground.
- Canada’s PMI, Building Permits muddy the waters.
- BoC Governor Macklem due to speak in Montreal.

The Canadian Dollar (CAD) managed to pump the brakes on a two-day backslide on Tuesday, but a recovery seems limited as Canadian economic figures look mixed. Loonie bidders awaited Bank of Canada (BoC) Governor Tiff Macklem’s input, who gave a speech regarding the effectiveness and limitations of monetary policy at the Montreal Council on Foreign Relations.
Canada saw a steep decline in the MoM Building Permits in December as well as downside revisions to the previous months’ releases, though the revision-heavy indicator is prone to having a muted impact. The seasonally-adjusted Ivey Purchasing Managers Index (PMI) for January ticked slightly higher, helping to offset any bearish trickles from Building Permits. Flat Crude Oil markets are also keeping the Canadian Dollar afloat but price action lacks momentum.
Daily digest market movers: Canadian Dollar takes a breather
- BoC Governor Macklem reaffirmed that the BoC is done with rate hikes, stating that 5% is largely viewed as the level the BoC thinks is necessary to continue draining momentum out of inflation.
- BoC's Macklem: policy discussion is shifting from whether or not policy is restrictive enough to how long it should remain restrictive.
- BoC's Macklem: path back to 2% inflation likely to be slow, risks remain.
- More Macklem: shelter prices are now the biggest contributor to above-target inflation.
- Canadian Building Permits declined 14% in December, far below the 1.2% expected uptick and the worst showing for Canadian Building Permits since last April.
- November’s Building Permits also saw a downside revision to -5% from -3.9%.
- Canada’s unadjusted Ivey PMI for January ticked upward to 54.4 from 43.7.
- The seasonally-adjusted Ivey PMI grew for a fourth straight month but was noticeably thinner at 56.5 versus the previous 56.3.
- Markets were expecting January’s adjusted Ivey PMI to decline to 55.0.
- Coming up this week, the Bank of Canada’s latest Summary of Deliberations will be released on Wednesday with wages and labor figures due on Friday.
Canadian Dollar price today
The table below shows the percentage change of Canadian Dollar (CAD) against listed major currencies today. Canadian Dollar was the strongest against the US Dollar.
| USD | EUR | GBP | CAD | AUD | JPY | NZD | CHF | |
| USD | -0.07% | -0.47% | -0.40% | -0.56% | -0.46% | -0.38% | -0.04% | |
| EUR | 0.07% | -0.40% | -0.34% | -0.50% | -0.40% | -0.31% | 0.03% | |
| GBP | 0.46% | 0.40% | 0.05% | -0.10% | 0.00% | 0.09% | 0.41% | |
| CAD | 0.40% | 0.34% | -0.05% | -0.16% | -0.05% | 0.03% | 0.37% | |
| AUD | 0.56% | 0.50% | 0.11% | 0.17% | 0.10% | 0.20% | 0.52% | |
| JPY | 0.46% | 0.40% | 0.00% | 0.04% | -0.12% | 0.10% | 0.41% | |
| NZD | 0.38% | 0.30% | -0.08% | -0.04% | -0.19% | -0.09% | 0.33% | |
| CHF | 0.05% | -0.02% | -0.42% | -0.36% | -0.52% | -0.42% | -0.33% |
The heat map shows percentage changes of major currencies against each other. The base currency is picked from the left column, while the quote currency is picked from the top row. For example, if you pick the Euro from the left column and move along the horizontal line to the Japanese Yen, the percentage change displayed in the box will represent EUR (base)/JPY (quote).
Technical analysis: Canadian Dollar finds flat ground as USD/CAD churns near 1.3500
The Canadian Dollar (CAD) is broadly mixed on Tuesday but looks upward with the CAD down a sixth of a percent against the Australian Dollar (AUD). The CAD is also up around four-tenths of a percent against the US Dollar (USD) and a third of a percent against the Euro (EUR).
USD/CAD drifted into a near-term ceiling at 1.3540 as the pair cycles near the 1.3500 handle. The pair climbed 1.33% bottom-to-top after the US Dollar rebounded against the Canadian Dollar late last week, and the CAD is looking for a foothold to make a recovery and drag the USD/CAD back below the 1.3500 level. This would be back toward the 200-hour Simple Moving Average (SMA) at 1.3450.
USD/CAD is struggling to maintain bullish momentum after breaking into the topside of the 200-day SMA on Monday, and the pair is at risk of getting dragged back into congestion between 1.3476 and 1.3426 as the 200-day and 50-day SMAs consolidate.
USD/CAD hourly chart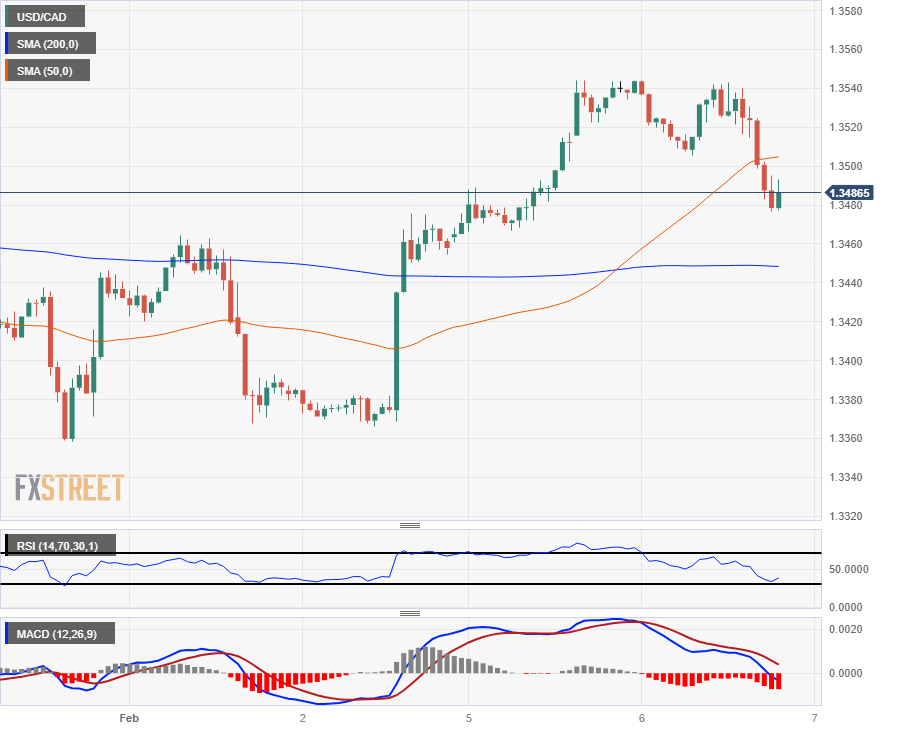
USD/CAD daily chart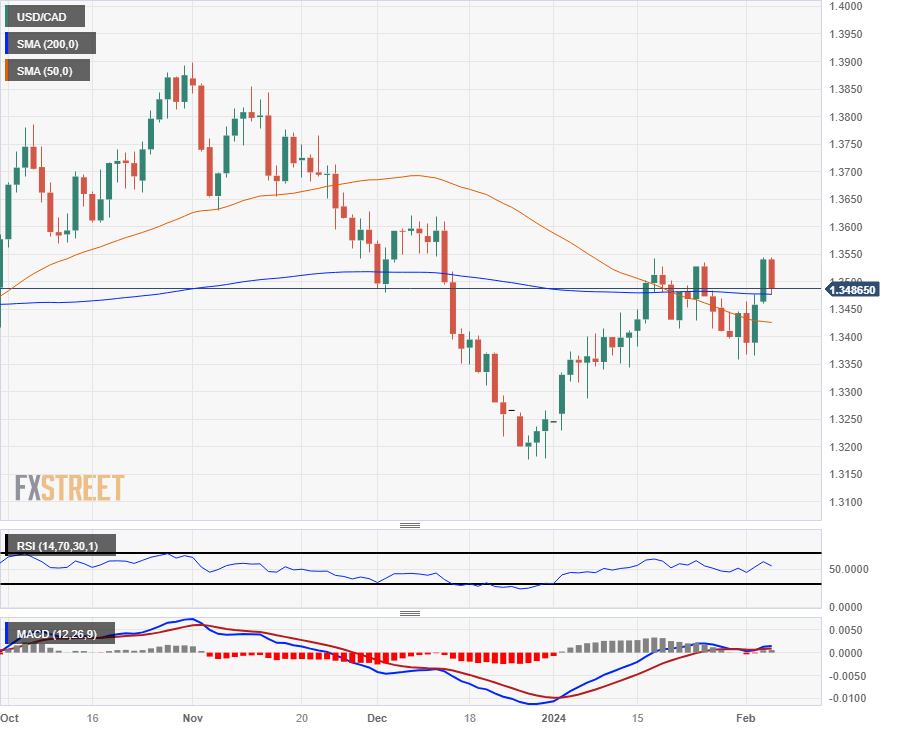
Bank of Canada FAQs
What is the Bank of Canada and how does it influence the Canadian Dollar?
The Bank of Canada (BoC), based in Ottawa, is the institution that sets interest rates and manages monetary policy for Canada. It does so at eight scheduled meetings a year and ad hoc emergency meetings that are held as required. The BoC primary mandate is to maintain price stability, which means keeping inflation at between 1-3%. Its main tool for achieving this is by raising or lowering interest rates. Relatively high interest rates will usually result in a stronger Canadian Dollar (CAD) and vice versa. Other tools used include quantitative easing and tightening.
What is Quantitative Easing (QE) and how does it affect the Canadian Dollar?
In extreme situations, the Bank of Canada can enact a policy tool called Quantitative Easing. QE is the process by which the BoC prints Canadian Dollars for the purpose of buying assets – usually government or corporate bonds – from financial institutions. QE usually results in a weaker CAD. QE is a last resort when simply lowering interest rates is unlikely to achieve the objective of price stability. The Bank of Canada used the measure during the Great Financial Crisis of 2009-11 when credit froze after banks lost faith in each other’s ability to repay debts.
What is Quantitative tightening (QT) and how does it affect the Canadian Dollar?
Quantitative tightening (QT) is the reverse of QE. It is undertaken after QE when an economic recovery is underway and inflation starts rising. Whilst in QE the Bank of Canada purchases government and corporate bonds from financial institutions to provide them with liquidity, in QT the BoC stops buying more assets, and stops reinvesting the principal maturing on the bonds it already holds. It is usually positive (or bullish) for the Canadian Dollar.
Author

Joshua Gibson
FXStreet
Joshua joins the FXStreet team as an Economics and Finance double major from Vancouver Island University with twelve years' experience as an independent trader focusing on technical analysis.


