Canadian Dollar extends losses after bumper NFP print
- The Canadian Dollar (CAD) eased lower after better-than-expected US NFP numbers.
- Canada saw an upswing in Ivey PMIs, but was passed over by market watchers.
- A firm jump in US NFP jobs additions toppled rate cut hopes to wrap up the trading week.

The Canadian Dollar (CAD) slipped further on Friday, driven lower by a broad-market extension of recent Greenback bidding that sent the US Dollar higher across the board after US Nonfarm Payrolls (NFP) figures widely outran expectations.
Canada’s Ivey Purchasing Manager’s Index (PMI) recovered in September, but the Canadian datapoint was swept aside by investors fully focused on US payrolls data. US NFP net job additions came in well above expectations in September, with upside revisions to several month’s of jobs figures. The rapid shift in the market’s outlook of the US labor market has widely shifted rate market bets of November’s Federal Reserve (Fed) rate cut.
Daily digest market movers
- The Canadian Dollar lost a scant one-fifth of one percent against the Greenback on Friday.
- Canada’s Ivey PMI for September recovered ground, climbing back into 54.9 after dipping to 50.3 the month prior.
- US NFP jobs data came in wildly above expectations, adding 254K net new job additions in September compared to the forecast 140K. August’s NFP print was also revised upwards to 159K.
- The US Unemployment Rate also ticked down to 4.1% from the previous 4.2%, further burying market hopes for a follow-up double rate cut from the Fed in November.
- According to the CME’s FedWatch Tool, rate traders now see an overwhelming 95% chance of a single 25 bps cut from the Fed on November 7, with a particularly beleaguered 5% expecting no movement at all.
- Hopes for a second 50 bps rate cut in November have entirely evaporated.
Canadian Dollar price forecast
The USD/CAD pair has been grinding higher over the past few sessions, with the pair finding itself at a critical juncture near the 50-day (1.3584) and 200-day (1.3602) Exponential Moving Averages (EMA). After a sustained downtrend from mid-August to early September, the pair has shown signs of stabilization, rebounding off the 1.3450 level.
This recent price action signals that USD/CAD could be testing the upper boundaries of its consolidation range, with potential resistance near the 1.3600 handle. While the pair remains below both the 50-day and 200-day EMAs, the proximity of these moving averages suggests a zone of significant technical resistance. A break above these levels could open the door for further gains, targeting the 1.3700 level.
On the downside, the pair appears to have found support around 1.3450, a key level that has acted as a floor in recent trading. A failure to hold above this level may lead to renewed selling pressure, potentially driving the pair back to the 1.3350 region.
USD/CAD daily chart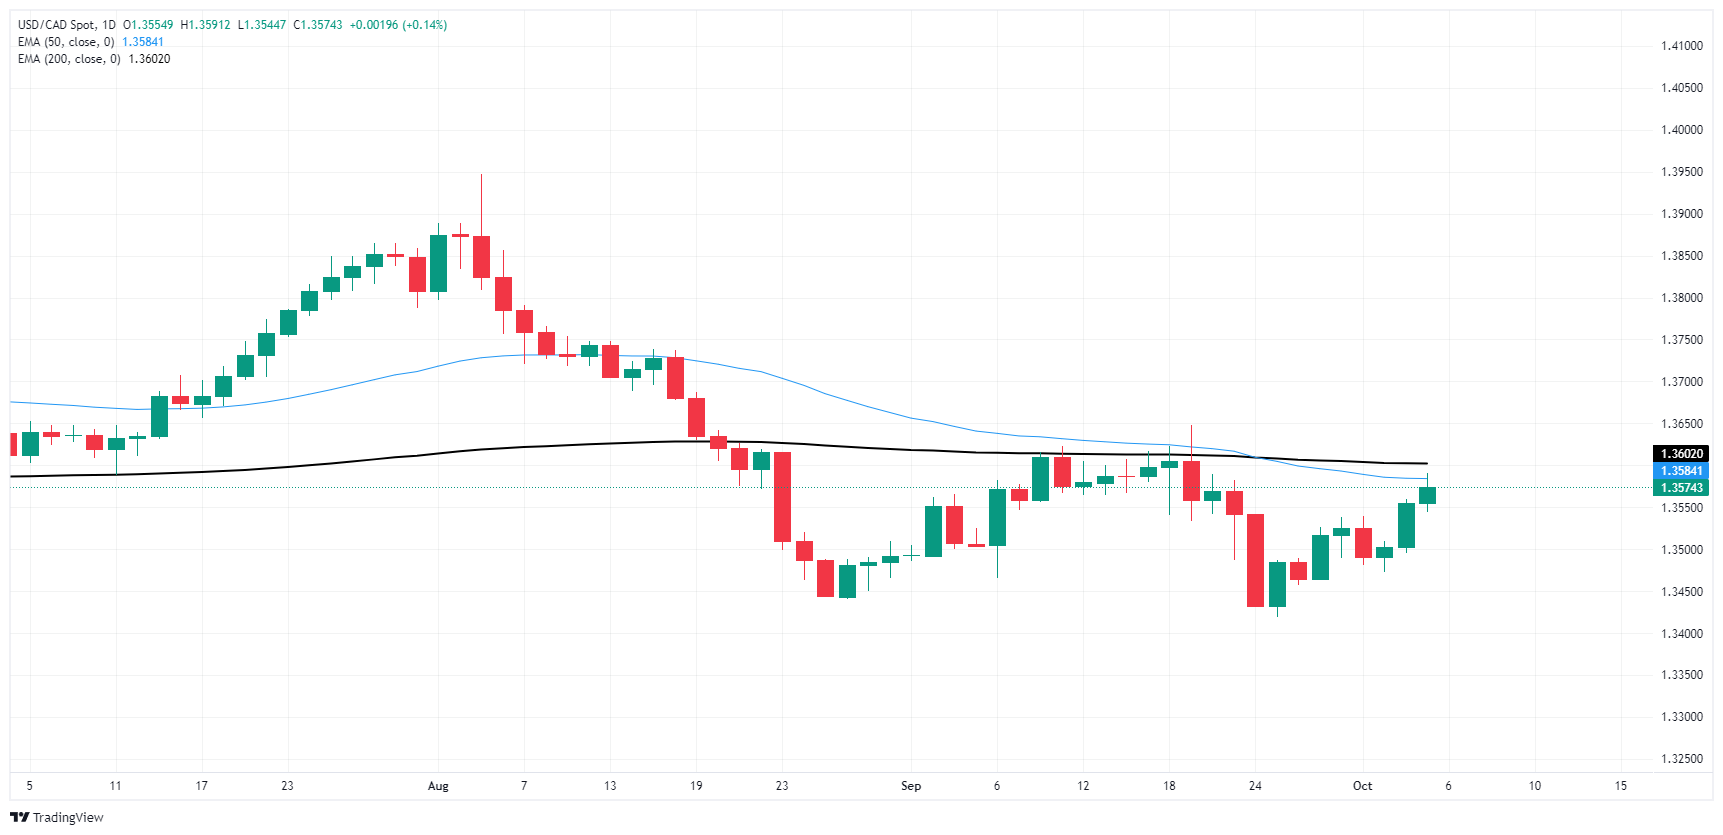
Economic Indicator
Nonfarm Payrolls
The Nonfarm Payrolls release presents the number of new jobs created in the US during the previous month in all non-agricultural businesses; it is released by the US Bureau of Labor Statistics (BLS). The monthly changes in payrolls can be extremely volatile. The number is also subject to strong reviews, which can also trigger volatility in the Forex board. Generally speaking, a high reading is seen as bullish for the US Dollar (USD), while a low reading is seen as bearish, although previous months' reviews and the Unemployment Rate are as relevant as the headline figure. The market's reaction, therefore, depends on how the market assesses all the data contained in the BLS report as a whole.
Read more.Last release: Fri Oct 04, 2024 12:30
Frequency: Monthly
Actual: 254K
Consensus: 140K
Previous: 142K
Source: US Bureau of Labor Statistics
America’s monthly jobs report is considered the most important economic indicator for forex traders. Released on the first Friday following the reported month, the change in the number of positions is closely correlated with the overall performance of the economy and is monitored by policymakers. Full employment is one of the Federal Reserve’s mandates and it considers developments in the labor market when setting its policies, thus impacting currencies. Despite several leading indicators shaping estimates, Nonfarm Payrolls tend to surprise markets and trigger substantial volatility. Actual figures beating the consensus tend to be USD bullish.
Author

Joshua Gibson
FXStreet
Joshua joins the FXStreet team as an Economics and Finance double major from Vancouver Island University with twelve years' experience as an independent trader focusing on technical analysis.


