Bill.com Stock Forecast: Earnings send BILL through chart resistance, next stop $185
- Bill.com has advanced 17% on Friday.
- BILL fiscal fourth quarter earnings beat analyst projections on top and bottom lines.
- The stock's advance has placed it above resistance at $168.

Bill.com (BILL) stock is up 16.7% at $174.36 during Friday's morning session after dazzling the market with an earnings beat on Thursday night. The software-as-a-service company, beloved nearly unanimously by Wall Street analysts, reported a beat on both top and bottom lines with adjusted earnings per share (EPS) of $-0.03 on revenue of $200.2 million. The EPS figure was 11 cents ahead of consensus, and revenue bested the average forecast by $17 million.
The market was mostly impressed with revenue that exploded 156% YoY. Transaction fees were up 201% YoY, and organic core revenue came in 71% YoY.
"In 2022, 400,000 businesses used our solutions to automate their financial operations, get paid faster, and better manage their cash flow, more than three times the number of businesses that used us in the prior fiscal year," said CEO and founder Rene Lacerte. "We managed more than $225 billion in payments, and our network grew to 4.7 million members that have originated or received an electronic payment through our platform."
Management guided for a midpoint of $209.5 million in revenue during the next quarter and said it would achieve a non-GAAP EPS of $0.05 to $0.07. The fact that Bill.com is turning the corner so quickly toward profitability also has helped to send the stock higher. The average analyst price target is $186.42.
Bill.com stock forecast
At the current run rate for fiscal 2023, Bill.com stock is trading close to 20 times sales (19.6x). That does not seem to matter to its outspoken supporters, however, which are mostly hedge funds and other instituional investors. Like Snowflake (SNOW), Bill.com gets to sit in the premium seats and has not fared as badly as other high-multiple tech stocks in 2022's sell-off. It still gets the benefit of the doubt.
Friday's rally has pushed BILL above the $168 resistance level. That price level worked as a support level in February and March. The rally also places it back in league with where it was before the May earnings release sent shares tumbling.
Now the $185 level should be the focal point for all bulls looking to take profits. This region of resistance stems from the latter half of April and also coincides with the consensus price target for the stock. Above there is the $210 level from early and mid-April. The Accumulation/Distribution indicator has been trending up since late May and probably gave some traders the hint that BILL was ready for a rally.
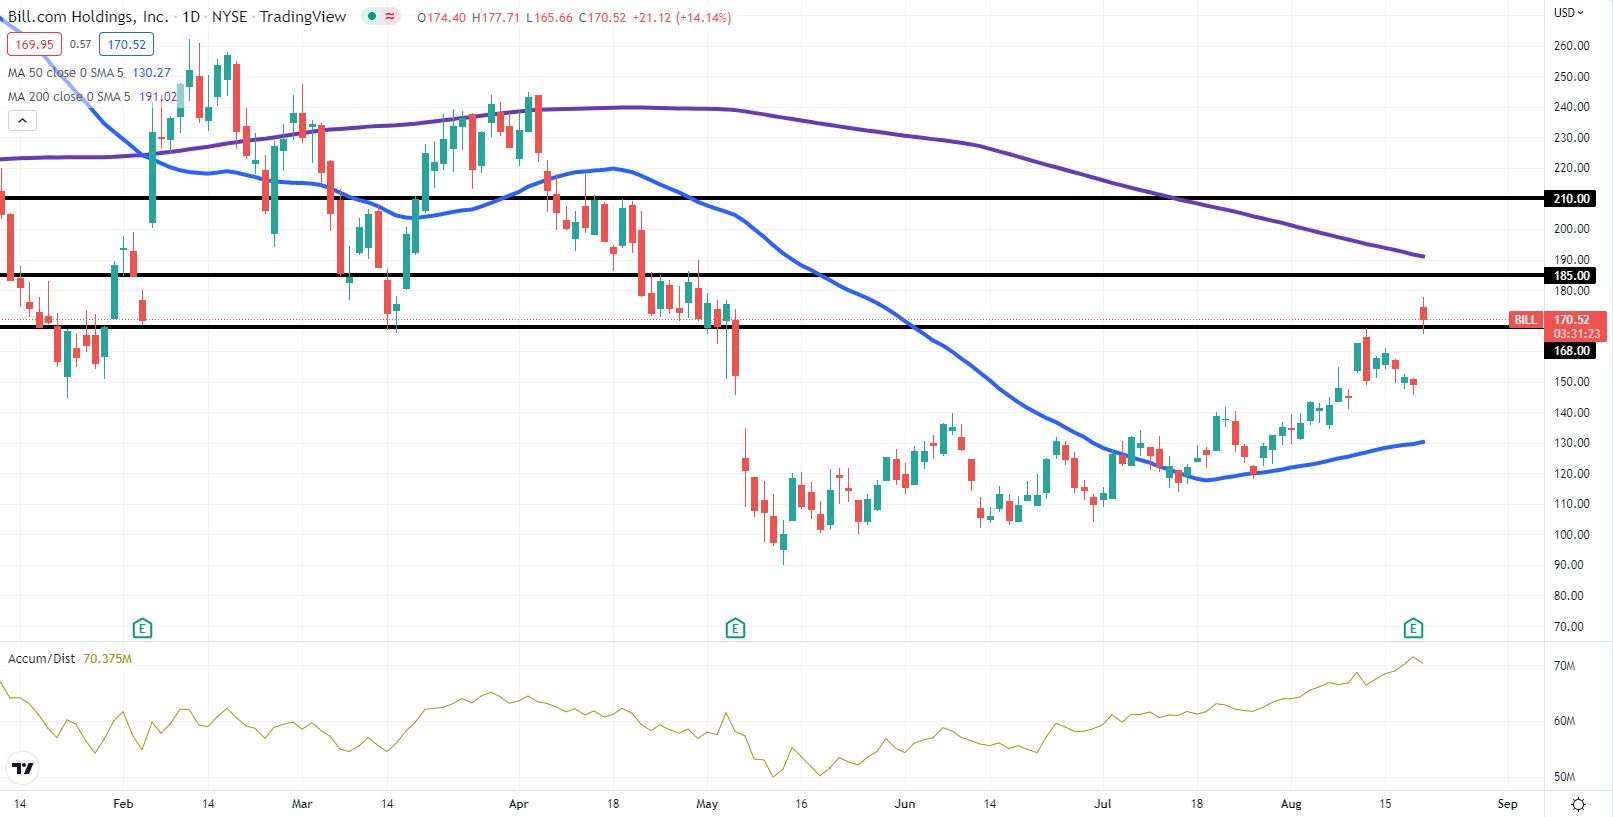
BILL daily chart
Premium
You have reached your limit of 3 free articles for this month.
Start your subscription and get access to all our original articles.
Author

Clay Webster
FXStreet
Clay Webster grew up in the US outside Buffalo, New York and Lancaster, Pennsylvania. He began investing after college following the 2008 financial crisis.