![]() Elliott Wave Forecast Team
Elliott Wave Forecast Team
ElliottWave-Forecast.com
Elliott Wave Structure in Bank of America (BAC) shows incomplete bullish sequence from 10.27.2023 low favoring further upside. Short Term, rally from 1.17.2024 low is unfolding as a 5 waves impulse Elliott Wave structure. Up from there, wave (1) ended at 35.1 and dips in wave (2) ended at 32.35. The stock extends higher again in wave (3). Up from wave (2), wave 1 ended at 36.45 and pullback in wave 2 ended at 35.24. The stock extended higher again in wave 3 towards 37.64 and pullback in wave 4 ended at 36.8. Final leg wave 5 ended at 38.35 which completed wave (3).
BAC 45 Minutes Elliott Wave chart
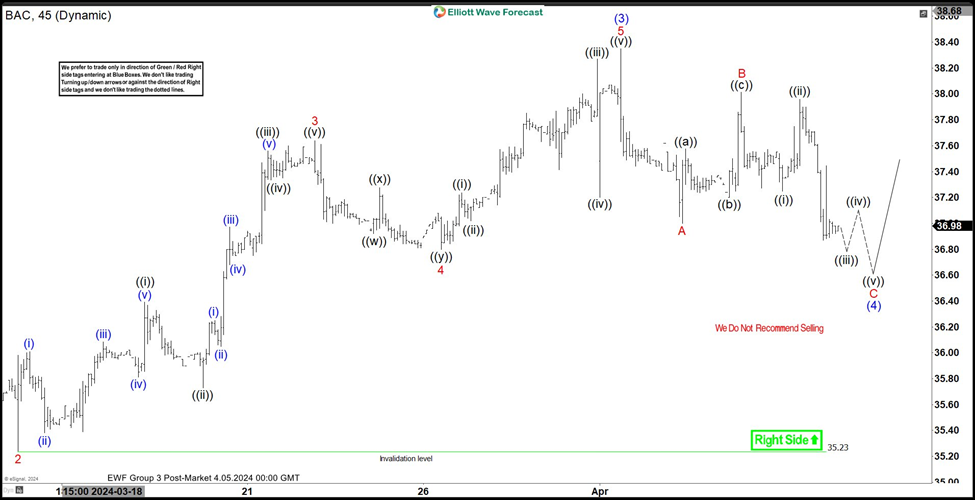
The stock is now pulling back in wave (4) with internal subdivision as a zigzag structure. Down from wave (3), wave A ended at 37 and rally in wave B ended at 38.02. Wave C lower is in progress and can see further downside as a 5 waves. Down from wave B, wave ((i)) ended at 37.25 and wave ((ii)) ended at 37.96. Wave C target can reach 100% – 161.8% Fibonacci extension of wave A. This area comes at 35.85 -36.68. From this area, the stock can see buyers for further upside or 3 waves rally at least.
BAC Elliott Wave video
FURTHER DISCLOSURES AND DISCLAIMER CONCERNING RISK, RESPONSIBILITY AND LIABILITY Trading in the Foreign Exchange market is a challenging opportunity where above average returns are available for educated and experienced investors who are willing to take above average risk. However, before deciding to participate in Foreign Exchange (FX) trading, you should carefully consider your investment objectives, level of xperience and risk appetite. Do not invest or trade capital you cannot afford to lose. EME PROCESSING AND CONSULTING, LLC, THEIR REPRESENTATIVES, AND ANYONE WORKING FOR OR WITHIN WWW.ELLIOTTWAVE- FORECAST.COM is not responsible for any loss from any form of distributed advice, signal, analysis, or content. Again, we fully DISCLOSE to the Subscriber base that the Service as a whole, the individual Parties, Representatives, or owners shall not be liable to any and all Subscribers for any losses or damages as a result of any action taken by the Subscriber from any trade idea or signal posted on the website(s) distributed through any form of social-media, email, the website, and/or any other electronic, written, verbal, or future form of communication . All analysis, trading signals, trading recommendations, all charts, communicated interpretations of the wave counts, and all content from any media form produced by www.Elliottwave-forecast.com and/or the Representatives are solely the opinions and best efforts of the respective author(s). In general Forex instruments are highly leveraged, and traders can lose some or all of their initial margin funds. All content provided by www.Elliottwave-forecast.com is expressed in good faith and is intended to help Subscribers succeed in the marketplace, but it is never guaranteed. There is no “holy grail” to trading or forecasting the market and we are wrong sometimes like everyone else. Please understand and accept the risk involved when making any trading and/or investment decision. UNDERSTAND that all the content we provide is protected through copyright of EME PROCESSING AND CONSULTING, LLC. It is illegal to disseminate in any form of communication any part or all of our proprietary information without specific authorization. UNDERSTAND that you also agree to not allow persons that are not PAID SUBSCRIBERS to view any of the content not released publicly. IF YOU ARE FOUND TO BE IN VIOLATION OF THESE RESTRICTIONS you or your firm (as the Subscriber) will be charged fully with no discount for one year subscription to our Premium Plus Plan at $1,799.88 for EACH person or firm who received any of our content illegally through the respected intermediary’s (Subscriber in violation of terms) channel(s) of communication.
Recommended content
Editors’ Picks
AUD/USD regains the constructive outlook above the 200-day SMA

AUD/USD advanced strongly for the second session in a row, this time extending the recovery to the upper 0.6500s and shifting its focus to the weekly highs in the 0.6580-0.6585 band, an area coincident with the 100-day SMA.
EUR/USD recovers to top end of consolidation ahead of Friday’s US NFP

EUR/USD drove back to the top end of recent consolidation on Thursday, recovering chart territory north of the 1.0700 handle as market risk appetite regains balance heading into another US Nonfarm Payrolls Friday.
Gold price pullback on Fed hawkish tilt amidst lower US yields, weaker US Dollar

Gold price clings to the $2,300 figure in the mid-North American session on Thursday amid an upbeat market sentiment, falling US Treasury yields, and a softer US Dollar. Traders are still digesting Wednesday’s Federal Reserve decision to hold rates unchanged.
Ethereum may sustain trading inside key range, ETH ETFs to be delayed until 2025

Ethereum is beginning to show signs of recovery on Thursday despite a second consecutive day of poor performance in Hong Kong's spot Ethereum ETFs. Bloomberg analyst James Seyffart has also shared that a spot Ethereum ETF may not happen in the US in 2024.
FOMC in the rear-view mirror – NFP eyed

The update from May’s FOMC rate announcement proved more dovish than expected, which naturally weighed on the US dollar (sending the DXY to lows of 105.44) and US yields, as well as, initially at least, underpinning major US equity indices.