Australian Dollar steadies as US Dollar remains softer ahead of Q3 GDP Annualized
- The Australian Dollar recovers daily losses after the release of Consumer Inflation Expectations on Thursday.
- Australia’s Consumer Inflation Expectations increased to 4.2% in December from the previous 3.8% rise.
- The US Dollar Index (DXY) marked 108.28, the highest level not seen since November 2022, on Thursday.

The Australian Dollar (AUD) pares daily losses following the release of Consumer Inflation Expectations on Thursday. However, the AUD/USD pair declined as the US Dollar (USD) appreciated as the Federal Reserve (Fed) delivered a hawkish cut of 25 basis points (bps) at its December meeting on Wednesday, bringing its benchmark lending rate to a range of 4.25%-4.50%, a two-year low.
Australia’s Consumer Inflation Expectations rose to 4.2% in December from 3.8% in the previous month, marking the highest level since September. However, the AUD struggles due to the increased likelihood that the Reserve Bank of Australia (RBA) will cut interest rates sooner and more significantly than initially expected. However, future decisions will be data-driven, with evolving risk assessments guiding the RBA's approach.
The US Dollar appreciated as the Summary of Economic Projections, or ‘dot-plot,’ showed only two rate cuts in 2025, down from the four they projected in September. Additionally, during the Press Conference, Fed Chair Jerome Powell made clear that the Fed will be cautious about further cuts as inflation remains stubbornly above the central bank’s 2% target.
Traders will likely observe the US weekly Initial Jobless Claims, Existing Home Sales, and final reading of Gross Domestic Product Annualized for the third quarter (Q3) due on Thursday.
Australian Dollar receives downward pressure following Fed’s hawkish rate cut
- National Australia Bank (NAB) maintains its forecast for the first Reserve Bank of Australia rate cut at the May 2025 meeting, though they acknowledge February as a possibility. NAB's report indicates that the Unemployment Rate is expected to peak at 4.3% before easing to 4.2% by 2026 as the economy stabilizes. The Q4 trimmed mean inflation is projected at 0.6% quarter-on-quarter, with a gradual easing expected, reaching 2.7% by late 2025.
- Australia's Westpac Consumer Confidence fell 2% to 92.8 points in December, reversing two months of positive momentum.
- On Tuesday, the US Census Bureau reported that US Retail Sales rose 0.7% MoM in November, compared to the 0.5% prior increase. Meanwhile, the Retail Sales Control Group increased 0.4% from the previous decline of 0.1%.
- Reuters cited two sources on Tuesday that China is set to target economic growth of around 5% in 2025. This decision follows a meeting among top Chinese officials at the Central Economic Work Conference last week. The growth target remains the same as this year, which China is expected to achieve.
- China's foreign exchange regulator, the State Administration of Foreign Exchange (SAFE), reported a net outflow of $45.7 billion from China's capital markets in November. Cross-border portfolio investment receipts totaled $188.9 billion, while payments reached $234.6 billion, resulting in the largest monthly deficit on record for this category.
- The preliminary S&P Global US Composite Purchasing Managers Index (PMI) rose to 56.6 in December, from 54.9 prior. Meanwhile, the Services PMI improved to 58.5 from 56.1. The Manufacturing PMI declined to 48.3 in December, from the previous 49.7 reading.
- Chinese authorities, led by President Xi Jinping, have pledged to raise the fiscal deficit target next year, shifting policy focus to consumption to boost the economy amid looming 10% US tariffs threatening exports. The lack of concrete details on fiscal support has put downward pressure on the AUD, given China's status as Australia's largest trading partner.
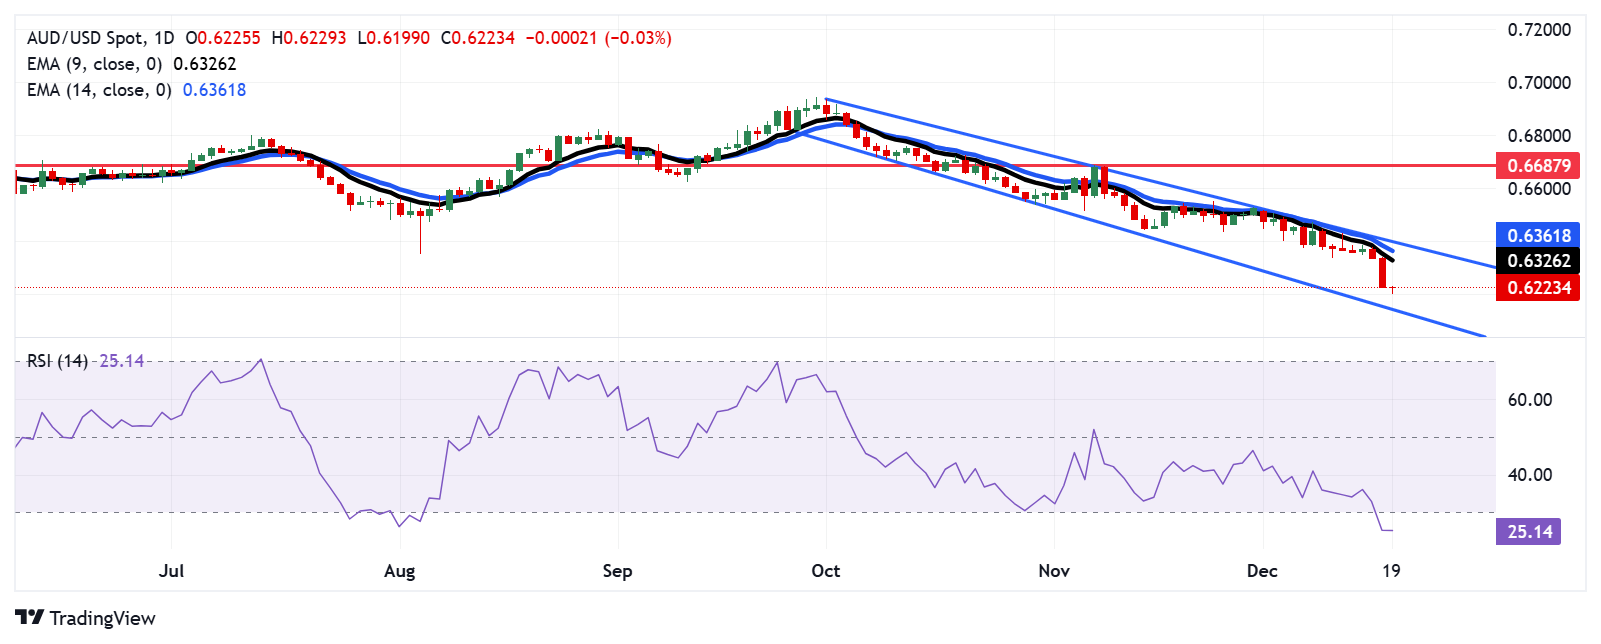
Australian Dollar holds position above 0.6200, descending channel’s lower boundary
The AUD/USD pair trades near 0.6220 on Thursday. Analysis of a daily chart suggests a prevailing bearish bias as the pair moves downwards within a descending channel pattern. However, the 14-day Relative Strength Index (RSI) has broken below the 30 level, indicating an oversold situation and a potential for an upward correction soon.
Regarding support, the AUD/USD pair could navigate the descending channel’s lower boundary around the 0.6140 level.
On the upside, the AUD/USD pair may find its initial resistance around the nine-day Exponential Moving Average (EMA) at 0.6326, followed by the 14-day EMA at 0.6362, aligned with the descending channel’s upper boundary at 0.6400 level. A decisive breakout above this channel could drive the pair toward the eight-week high at 0.6687.
AUD/USD: Daily Chart
Australian Dollar PRICE Today
The table below shows the percentage change of Australian Dollar (AUD) against listed major currencies today. Australian Dollar was the weakest against the Euro.
| USD | EUR | GBP | JPY | CAD | AUD | NZD | CHF | |
|---|---|---|---|---|---|---|---|---|
| USD | -0.16% | -0.09% | 0.43% | 0.02% | 0.02% | 0.51% | -0.06% | |
| EUR | 0.16% | 0.07% | 0.53% | 0.18% | 0.19% | 0.67% | 0.11% | |
| GBP | 0.09% | -0.07% | 0.51% | 0.13% | 0.11% | 0.60% | 0.05% | |
| JPY | -0.43% | -0.53% | -0.51% | -0.38% | -0.39% | 0.06% | -0.45% | |
| CAD | -0.02% | -0.18% | -0.13% | 0.38% | 0.00% | 0.48% | -0.06% | |
| AUD | -0.02% | -0.19% | -0.11% | 0.39% | -0.00% | 0.50% | -0.06% | |
| NZD | -0.51% | -0.67% | -0.60% | -0.06% | -0.48% | -0.50% | -0.55% | |
| CHF | 0.06% | -0.11% | -0.05% | 0.45% | 0.06% | 0.06% | 0.55% |
The heat map shows percentage changes of major currencies against each other. The base currency is picked from the left column, while the quote currency is picked from the top row. For example, if you pick the Australian Dollar from the left column and move along the horizontal line to the US Dollar, the percentage change displayed in the box will represent AUD (base)/USD (quote).
Economic Indicator
Gross Domestic Product Annualized
The real Gross Domestic Product (GDP) Annualized, released quarterly by the US Bureau of Economic Analysis, measures the value of the final goods and services produced in the United States in a given period of time. Changes in GDP are the most popular indicator of the nation’s overall economic health. The data is expressed at an annualized rate, which means that the rate has been adjusted to reflect the amount GDP would have changed over a year’s time, had it continued to grow at that specific rate. Generally speaking, a high reading is seen as bullish for the US Dollar (USD), while a low reading is seen as bearish.
Read more.Next release: Thu Dec 19, 2024 13:30
Frequency: Quarterly
Consensus: 2.8%
Previous: 2.8%
Source: US Bureau of Economic Analysis
The US Bureau of Economic Analysis (BEA) releases the Gross Domestic Product (GDP) growth on an annualized basis for each quarter. After publishing the first estimate, the BEA revises the data two more times, with the third release representing the final reading. Usually, the first estimate is the main market mover and a positive surprise is seen as a USD-positive development while a disappointing print is likely to weigh on the greenback. Market participants usually dismiss the second and third releases as they are generally not significant enough to meaningfully alter the growth picture.
Author

Akhtar Faruqui
FXStreet
Akhtar Faruqui is a Forex Analyst based in New Delhi, India. With a keen eye for market trends and a passion for dissecting complex financial dynamics, he is dedicated to delivering accurate and insightful Forex news and analysis.


