Australian Dollar consolidates as traders adopt caution ahead of US PCE Price Index
- The Australian Dollar steadies after mixed economic data from Australia and China’s NBS PMI released on Thursday.
- Australian Retail Sales rose by 0.1% MoM in September, against the expected 0.3% and the previous 0.7% growth.
- Traders await the upcoming US PCE inflation data on Thursday and Nonfarm Payrolls on Friday.

The Australian Dollar (AUD) remains steady following the release of mixed economic data from Australia and China’s NBS Purchasing Managers Index (PMI) on Thursday. However, hawkish expectations for the Reserve Bank of Australia's (RBA) policy outlook continued to support the Aussie Dollar and limit the downside of the AUD/USD pair.
In September, seasonally adjusted Australian Retail Sales rose by 0.1% month-over-month, falling short of the expected 0.3% and significantly down from the 0.7% growth seen in the previous month. On a quarterly basis, Retail Sales increased by 0.5% in Q3, rebounding from a 0.3% decline in the prior quarter.
The US Dollar (USD) gains some traction as market caution lingers amid uncertainty surrounding the upcoming US presidential election. The Greenback, however, encountered headwinds as the US Gross Domestic Product (GDP) annualized expanded by 2.8% in Q3, below 3.0% in Q2 and forecasts of 3.0%.
Traders are now focusing on upcoming key US data releases: PCE inflation data on Thursday and Nonfarm Payrolls (NFP) on Friday.
Daily Digest Market Movers: Australian Dollar moves sideways after mixed economic data
- The Australian Dollar faced downward pressure after Australia's lower-than-expected third-quarter Consumer Price Index (CPI) data was released on Wednesday. However, mixed economic data from the United States (US) balanced out this effect.
- China's NBS Non-Manufacturing PMI rose to 50.2 in October, up from 50.0 in the previous month but slightly below market expectations of 50.4. Meanwhile, the NBS Manufacturing PMI edged up to 50.1 from the prior reading of 49.8, modestly surpassing the forecast of 50.0.
- The ADP Employment Change report showed that private businesses in the United States added 233,000 workers in October, marking the largest increase since July 2023. This followed an upward revision to 159,000 in September and significantly exceeded forecasts of 115,000.
- The Australian Bureau of Statistics reported that the Consumer Price Index (CPI) rose just 0.2% quarter-over-quarter in the third quarter, down from 1.0% in the previous quarter and slightly below the anticipated 0.3%. The monthly CPI rose by 2.1% year-over-year in September, coming in below market expectations of 2.3% and down from August's reading of 2.7%.
- On Tuesday, the US Bureau of Labor Statistics (BLS) reported that JOLTS Job Openings reached 7.443 million in September, down from 7.861 million in August and falling short of the market expectation of 7.99 million.
- The Reserve Bank of Australia signaled that the current cash rate of 4.35% is sufficiently restrictive to guide inflation back to the target range of 2%-3% while continuing to support employment. As a result, a rate cut in November appears unlikely.
- ANZ-Roy Morgan Australia Consumer Confidence dropped to 86.4 this week, down from 87.5 the previous week.
Technical Analysis: Australian Dollar steadies above 0.6550 close to descending channel’s upper boundary
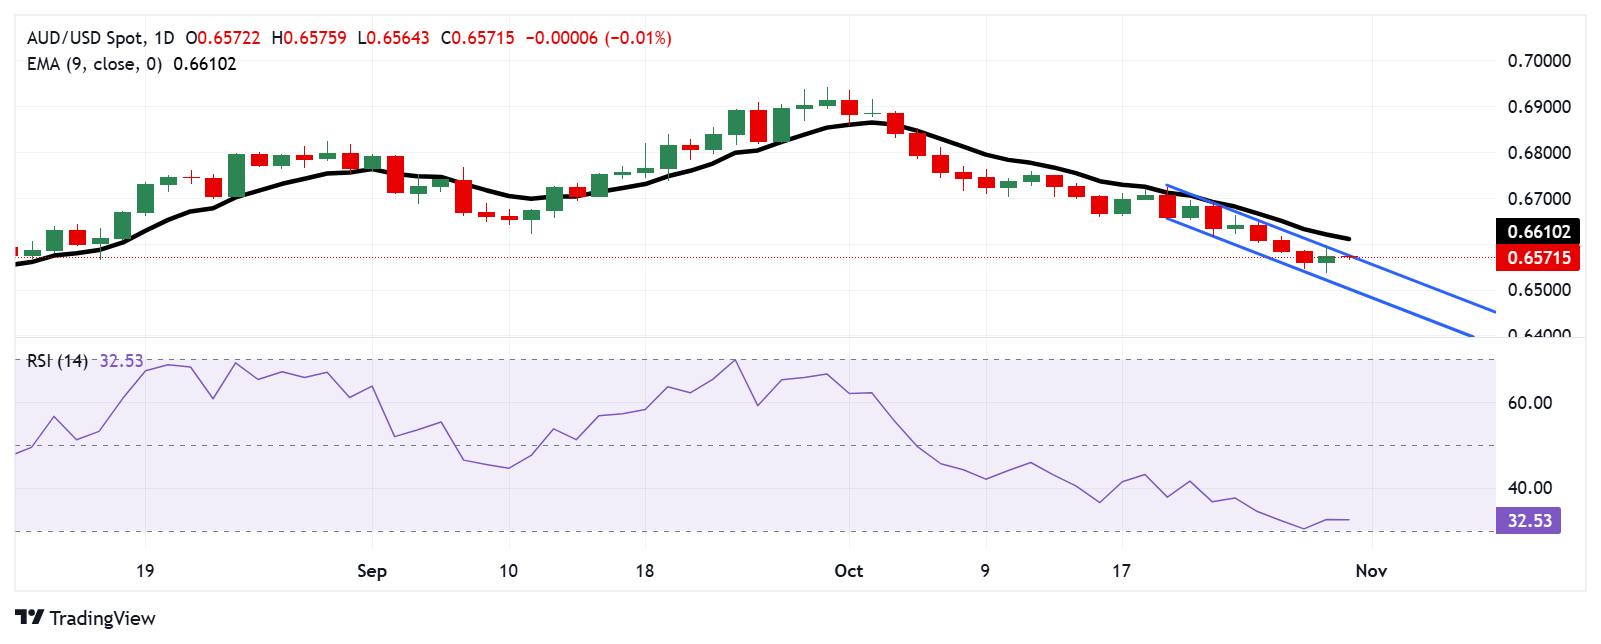
AUD/USD hovers near 0.6570 on Thursday. The daily chart shows a short-term bearish trend as the pair trades within a descending channel. The 14-day Relative Strength Index (RSI) is trending lower and sits just above the 30 level, reinforcing the bearish sentiment.
On the support side, the AUD/USD may test the lower boundary of the descending channel around 0.6510, followed by the key psychological level of 0.6500.
For resistance, the AUD/USD pair challenges the upper boundary of the descending channel near 0.6580, with another psychological barrier at 0.6600. A breakout above this could open the path toward the nine-day Exponential Moving Average (EMA) at 0.6608.
AUD/USD: Daily Chart
Australian Dollar PRICE Today
The table below shows the percentage change of Australian Dollar (AUD) against listed major currencies today. Australian Dollar was the strongest against the Canadian Dollar.
| USD | EUR | GBP | JPY | CAD | AUD | NZD | CHF | |
|---|---|---|---|---|---|---|---|---|
| USD | 0.01% | -0.10% | -0.88% | 0.07% | -0.05% | -0.08% | -0.26% | |
| EUR | -0.01% | -0.10% | -0.91% | 0.07% | -0.05% | -0.09% | -0.25% | |
| GBP | 0.10% | 0.10% | -0.79% | 0.17% | 0.05% | 0.00% | -0.16% | |
| JPY | 0.88% | 0.91% | 0.79% | 0.95% | 0.85% | 0.75% | 0.62% | |
| CAD | -0.07% | -0.07% | -0.17% | -0.95% | -0.11% | -0.17% | -0.34% | |
| AUD | 0.05% | 0.05% | -0.05% | -0.85% | 0.11% | -0.04% | -0.24% | |
| NZD | 0.08% | 0.09% | -0.01% | -0.75% | 0.17% | 0.04% | -0.17% | |
| CHF | 0.26% | 0.25% | 0.16% | -0.62% | 0.34% | 0.24% | 0.17% |
The heat map shows percentage changes of major currencies against each other. The base currency is picked from the left column, while the quote currency is picked from the top row. For example, if you pick the Australian Dollar from the left column and move along the horizontal line to the US Dollar, the percentage change displayed in the box will represent AUD (base)/USD (quote).
Economic Indicator
Personal Consumption Expenditures - Price Index (YoY)
The Personal Consumption Expenditures (PCE), released by the US Bureau of Economic Analysis on a monthly basis, measures the changes in the prices of goods and services purchased by consumers in the United States (US). The YoY reading compares prices in the reference month to a year earlier. Price changes may cause consumers to switch from buying one good to another and the PCE Deflator can account for such substitutions. This makes it the preferred measure of inflation for the Federal Reserve. Generally, a high reading is bullish for the US Dollar (USD), while a low reading is bearish.
Read more.Next release: Thu Oct 31, 2024 12:30
Frequency: Monthly
Consensus: 2.1%
Previous: 2.2%
Source: US Bureau of Economic Analysis
Author

Akhtar Faruqui
FXStreet
Akhtar Faruqui is a Forex Analyst based in New Delhi, India. With a keen eye for market trends and a passion for dissecting complex financial dynamics, he is dedicated to delivering accurate and insightful Forex news and analysis.