|

AUDUSD Price Analysis: Test of an inverted H&S breakout looks likely around 0.6550

  • A test of an inverted H&S breakout with less volatility will present an optimal buying opportunity.
  • Cheerful market mood post softer US October’s inflation report has strengthened the Aussie bulls.
  • The 50-and 200-EMAs are on the verge of delivering a golden cross.

The AUDUSD pair has witnessed modest exhaustion in the upside momentum after printing a fresh six-week high of 0.6632. An upside bias for the asset is still solid as the market mood is jubilant after a noteworthy decline in the US inflation data.

Bets for a fifth consecutive 75 basis point (bps) rate hike by the Federal Reserve (Fed) are vanishing and the US dollar index (DXY) and yields on US government bonds are getting punished. Meanwhile, trading activity in the US could be on reduced volume as US markets will remain closed on Friday on account of Veterans Day.

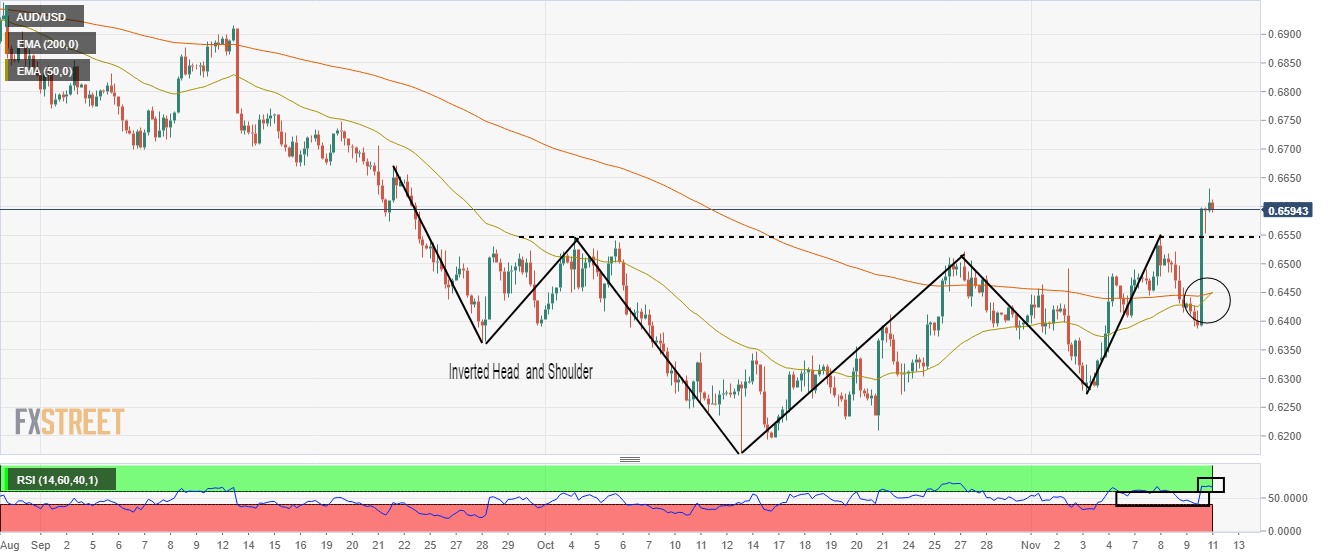
On a four-hour scale, the asset has delivered a breakout of the Inverted Head and Shoulder chart pattern that signals a bullish reversal after a prolonged consolidation. The neckline of the aforementioned chart pattern is plotted from October 4 high at 0.6548.

The 50-and 200-period Exponential Moving Averages (EMAs) are on the verge of delivering a golden cross, which will further strengthen the antipodean.

Meanwhile, the Relative Strength Index (RSI) (14) has shifted into the bullish range of 60.00-80.00, which indicates more upside ahead.

Going forward, a test of the Inverted H&S neckline at 0.6548 will trigger a bargain buy and will drive the asset toward Thursday’s high at 0.6632, followed by the round-level resistance at 0.6700.

Alternatively, a decline below Thursday’s low at 0.6386 will drag the asset toward October 14 high at 0.6347. A downside break of October 14 high will expose the asset for more downside toward November 3 low at 0.6272.

AUDUSD four-hour chart

AUD/USD

Overview
Today last price0.6592
Today Daily Change-0.0024
Today Daily Change %-0.36
Today daily open0.6616
 
Trends
Daily SMA200.6386
Daily SMA500.6504
Daily SMA1000.6706
Daily SMA2000.696
 
Levels
Previous Daily High0.662
Previous Daily Low0.6387
Previous Weekly High0.6493
Previous Weekly Low0.6272
Previous Monthly High0.6548
Previous Monthly Low0.617
Daily Fibonacci 38.2%0.6531
Daily Fibonacci 61.8%0.6476
Daily Pivot Point S10.6462
Daily Pivot Point S20.6307
Daily Pivot Point S30.6228
Daily Pivot Point R10.6696
Daily Pivot Point R20.6775
Daily Pivot Point R30.6929

Author

Sagar Dua

Sagar Dua

FXStreet

Sagar Dua is associated with the financial markets from his college days. Along with pursuing post-graduation in Commerce in 2014, he started his markets training with chart analysis.

More from Sagar Dua
Share:

Editor's Picks

EUR/USD slumps below 1.1750 as USD benefits from risk-aversion

EUR/USD comes under renewed bearish pressure in the European session and trades below 1.1750 following a recovery attempt earlier in the day. The US Dollar gathers strength and weighs on the pair as investors seek refuge in the wake of Israel and the United States' joint attack on Iran.

GBP/USD targets 1.3500 barrier near moving averages

GBP/USD rebounds from the daily losses, trading around 1.3450 during the Asian hours on Monday. The technical analysis of the daily chart indicates an ongoing bearish bias, as the pair trades within a descending channel pattern.

Gold surges on safe-haven demand, rises above $5,400

Gold benefits from intense risk-aversion on Monday and climbs above $5,400, setting a fresh monthly-high in the process. Tensions in the Middle East remain high as Israel and Hezbollah continue to exchange strikes following the US-Israel joint attack on Iran over the weekend.

Bitcoin, Ethereum and Ripple under pressure as key supports face breakdown risk

Bitcoin, Ethereum, and Ripple prices trade on the back foot at the start of this week on Monday, after extending losses in the previous week. BTC is on the brink of a breakdown, ETH is capped below key resistance, and XRP risks a crack of the trendline.

The market is paying for insurance, not apocalypse

As expected, this morning felt less like a Monday market open and more like a fire drill. Futures screens flickered red. S&P contracts down almost 1%. Nasdaq off 1.2%. Brent leaped 13% through $80. Gold rose 1.6% toward $5350 before paring some gains. The dollar is strutting mildly. The Swiss franc is quietly doing what it always does in a storm, catching some safe-haven flows.

Pi Network Price Forecast: Core team offloads supply, weighing on PI recovery

Pi Network  hovers below $0.1700, broadly steady at press time on Monday, attempting a recovery after a 2% loss the previous day. Sunday’s decline aligned with nearly 49 million PI tokens offloaded by the Pi Foundation, implying a spike in supply pressure that capped the prevailing four-day recovery.