AUD/USD slides as weak inflation data fuels RBA rate cut bets
- Australian inflation missed expectations, reinforcing RBA rate cut speculation.
- US-China trade tensions keep pressure on the Aussie.
- Markets await the Fed’s decision for further direction.

The AUD/USD dropped by 0.57% to 0.6225 on Wednesday, struggling near weekly lows below 0.6250. Softer-than-expected inflation data from Australia strengthened expectations of a February rate cut by the Reserve Bank of Australia (RBA), putting additional pressure on the Aussie. Weak economic signals from China and escalating US-Sino trade tensions further dampened sentiment, while investors awaited the Federal Reserve’s policy decision later in the day.
Market sentiment remains cautious as investors await the Federal Reserve's (Fed) highly anticipated monetary policy decision. While the central bank is widely expected to keep interest rates steady, market participants are keen to gauge its stance on future rate cuts. Any hawkish tilt from the Fed, emphasizing persistent inflation risks or delaying policy easing, could drive further strength in the US Dollar, pressuring the AUD/USD lower.
At the same time, Australia’s inflation figures came in below expectations, adding to speculation that the RBA will ease monetary policy in its upcoming meeting. The latest data showed that quarterly inflation rose by just 0.2%, missing the projected 0.3%. On an annual basis, inflation slowed to 2.4%, down from 2.8% in the previous quarter and below the expected 2.5%. While December’s Monthly CPI increased by 2.5%, as forecasted, it remained within the RBA’s 2%-3% target range.
Adding to the Aussie’s challenges, concerns over potential US tariffs on Chinese goods continue to mount. White House Press Secretary Karoline Leavitt reiterated that President Donald Trump is still considering imposing 10% tariffs on China, with a decision expected in February.
Technical overview
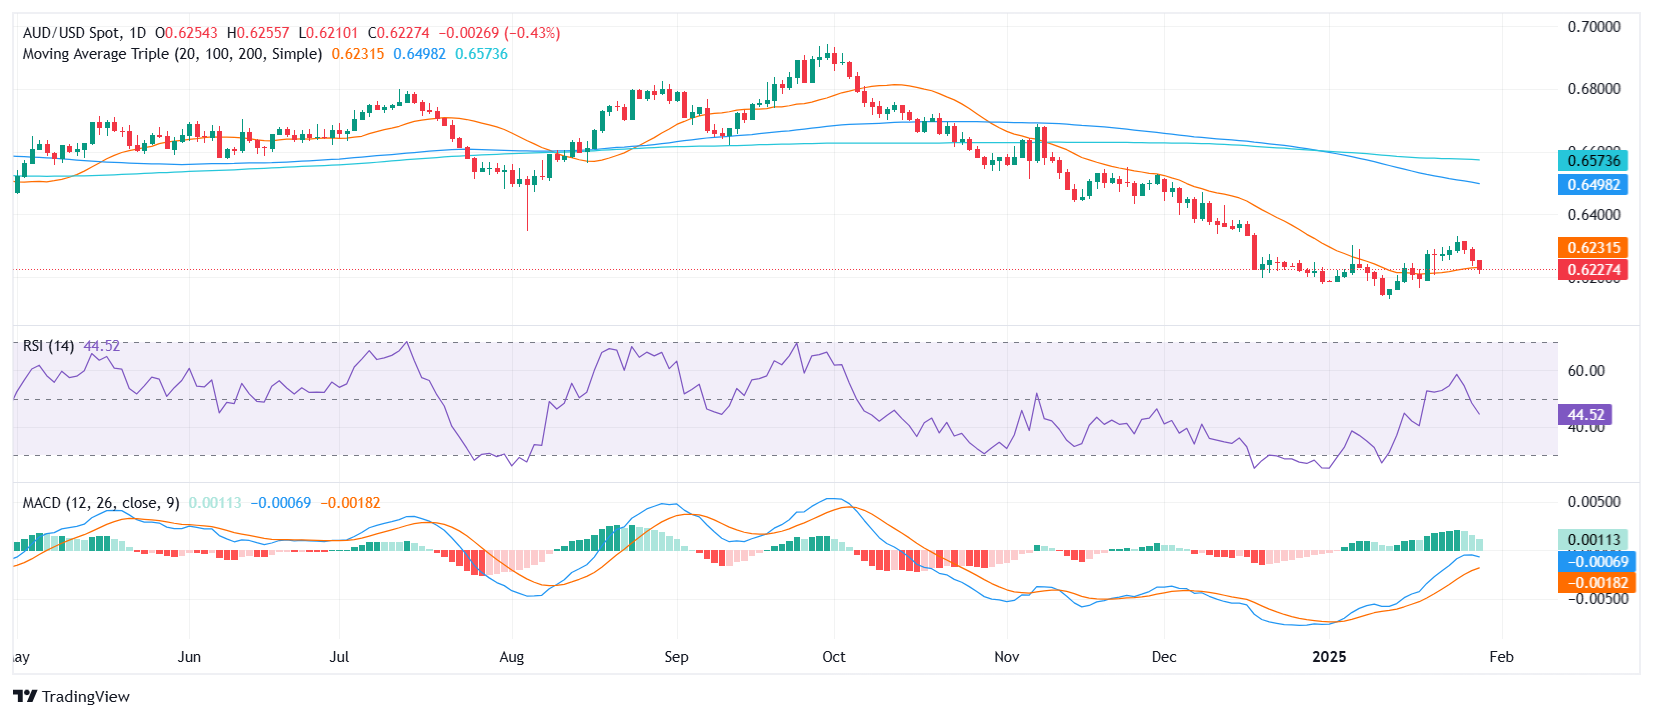
The AUD/USD remains under pressure, trading within a tight range as it struggles to recover. The Relative Strength Index (RSI) stands at 43, sharply declining in negative territory, indicating sustained bearish momentum. Meanwhile, the MACD histogram prints green bars but declinig, signaling some bullish presence.
Despite recent losses, technical indicators suggest mixed signals. The MACD hints at potential upside, while the RSI remains bearish. If the pair fails to reclaim the 20-day Simple Moving Average (SMA) at 0.6230, selling pressure could intensify. Immediate support is seen at 0.6200, with a break lower exposing 0.6170. Resistance remains at 0.6250, followed by 0.6300.
AUD/USD daily chart
Author

Patricio Martín
FXStreet
Patricio is an economist from Argentina passionate about global finance and understanding the daily movements of the markets.


