|

AUD/USD Price Forecast: Price is at a crossroads – is it correcting or reversing lower?

  • AUD/USD is at a critical level for the uptrend. 
  • Whilst a recovery is possible, more downside could also signal a reversal. 
  • The pair has reached the top of a range at a similar level to where it rotated in July. 

AUD/USD has been in an uptrend all through August. It reached a new peak of 0.6824 on August 29 and then pulled back. 

The correction so far is a three wave structure, perhaps an ABC correction, suggesting it is just a counter-trend reaction and the uptrend will probably resume. 

If AUD/USD can close back above 0.6800 it will signal a continuation of the uptrend back up to the 0.6824 high first, then possibly higher. 

AUD/USD 4-hour Chart

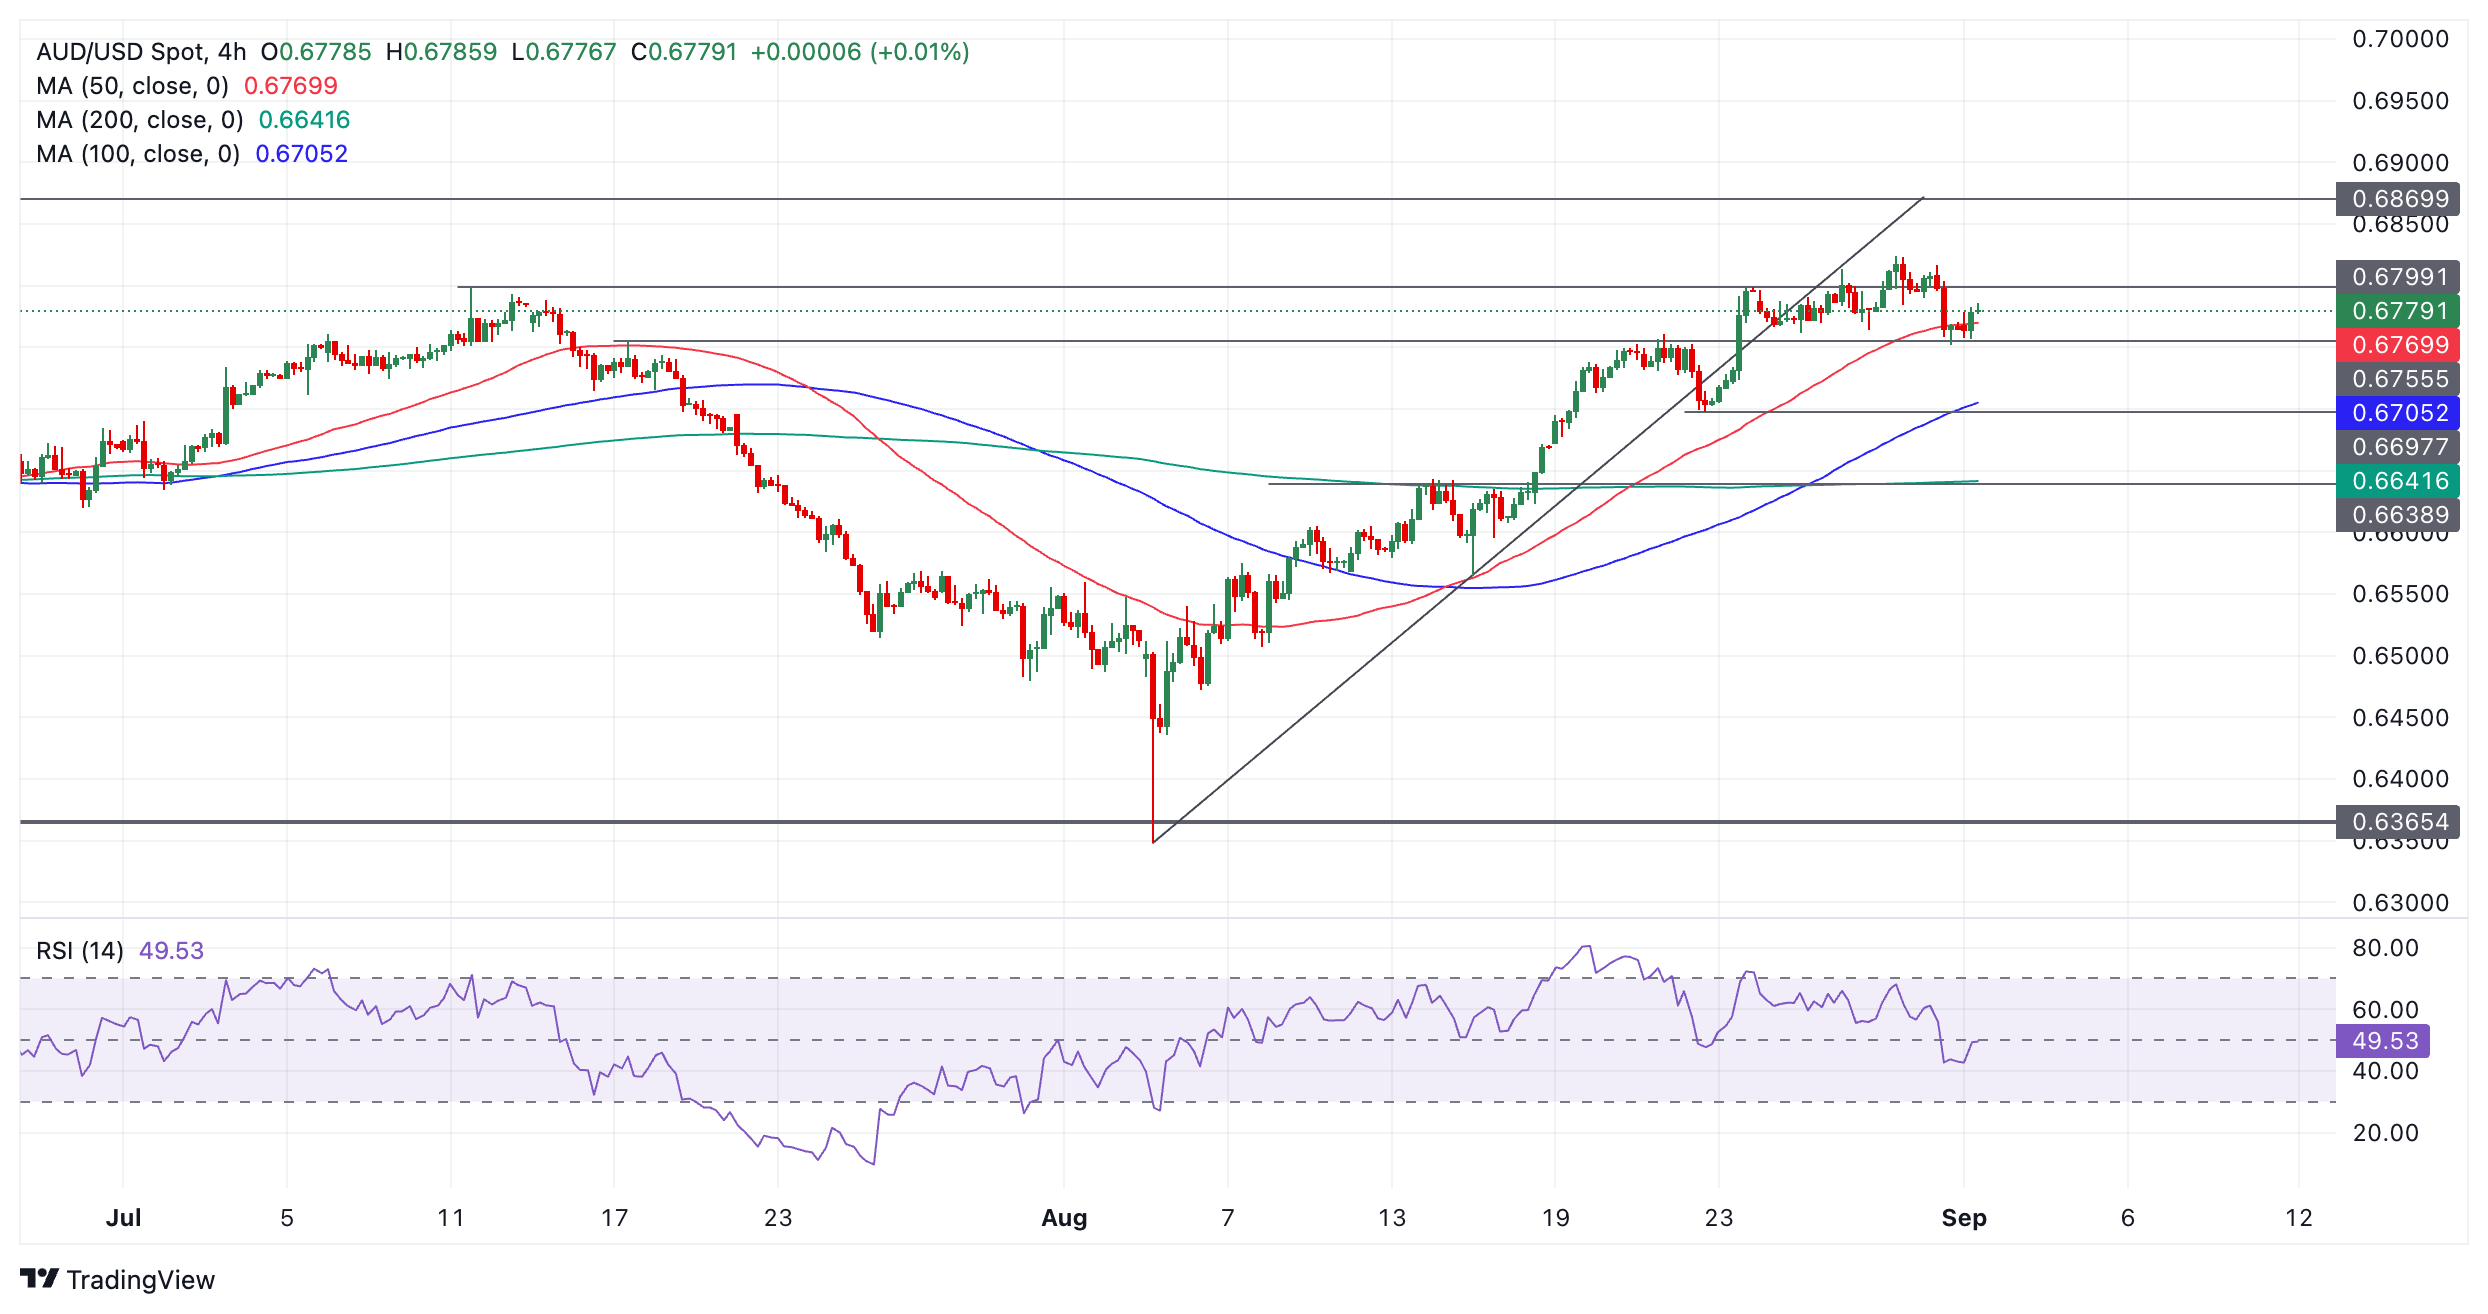
An extension lower, however, would bring into question this hypothesis and possibly suggest the correction might actually be the start of a new downtrend. 

For confirmation price would need to close below 0.6751, (low of August 30). That would likely be followed by a move down to 0.6700-05 and the 200-period Simple Moving Average (SMA). 

AUD/USD is a broad sideways range and it has retested resistance at the top of the range like it did in July. This could be another indication the short-term trend may be about to change and price could start declining again.  

The Relative Strength Index (RSI) momentum indicator is in the lower half of its range. It is showing quite strong bearish momentum accompanied the pull back from the August 29 high. 

Author

Joaquin Monfort

Joaquin Monfort is a financial writer and analyst with over 10 years experience writing about financial markets and alt data. He holds a degree in Anthropology from London University and a Diploma in Technical analysis.

More from Joaquin Monfort
Share:

Editor's Picks

AUD/USD eyes 0.7150 barrier nine-day EMA

AUD/USD inches higher after registering modest losses in the previous day, trading around 0.7130 during the Asian hours. The technical analysis of the daily chart indicates that the pair is moving sideways within the rectangle pattern, suggesting a consolidation as neither the bulls nor the bears have enough momentum to take control of the market.

USD/JPY trades below 160.00 intervention threshold; bullish bias intact

The USD/JPY pair attracts some sellers during the Asian session amid fears that authorities will step in again to prop up the Japanese Yen. Furthermore, the Israel-Lebanon truce prompts some profit-taking around the US Dollar and exerts downward pressure on the currency pair.

Gold defends 200-day SMA at $4,425, but for how long?

Gold is attempting a tepid recovery toward $4,500 early Thursday, as renewed optimism in the Mideast geopolitical front calms market nerves. This cautious optimism across Asian markets weighs on Oil prices, and diminishes the US Dollar’s safe-haven appeal, helping Gold stage a decent comeback from the weekly low of $4,424.


Hyperliquid: ETF demand, capital rotation fuel HYPE rally as Bitcoin melts

Hyperliquid price sustains an upward trend near its all-time high of $75.76 on Thursday after posting 80% gains in May, while Bitcoin (BTC) retraces below $65,000, triggering a market-wide panic.

Kevin Warsh takes the Fed helm: What it means for the US Dollar
The Federal Reserve moves away from the highly predictable "forward guidance" model of the Jerome Powell era to a new “Kevin Warsh environment”, characterized by less communication, more policy surprises, and an increased focus on the Fed's complex balance sheet.
Recession on paper: What really moves the Canadian Loonie now?

Statistics Canada handed the headline writers a gift and the analysts a headache. Real GDP shrank 0.1% on an annualized basis in the first quarter, and with the fourth quarter of 2025 revised down to a 1.0% contraction, that is two negative quarters in a row, the textbook definition of a technical recession and Canada's first since the pandemic.