|

AUD/USD Price Forecast: Gaps open and falls towards floor of range

  • AUD/USD gaps open on Monday and declines. 
  • The pair is in a sideways range and will probably continue oscillating. 
  • Gaps have a habit of getting filled, suggesting an up leg will eventually develop within the range. 

AUD/USD is falling within a range encompassed by the green (ceiling) and red (floor) dashed lines on the chart below. 

AUD/USD 4-hour Chart 

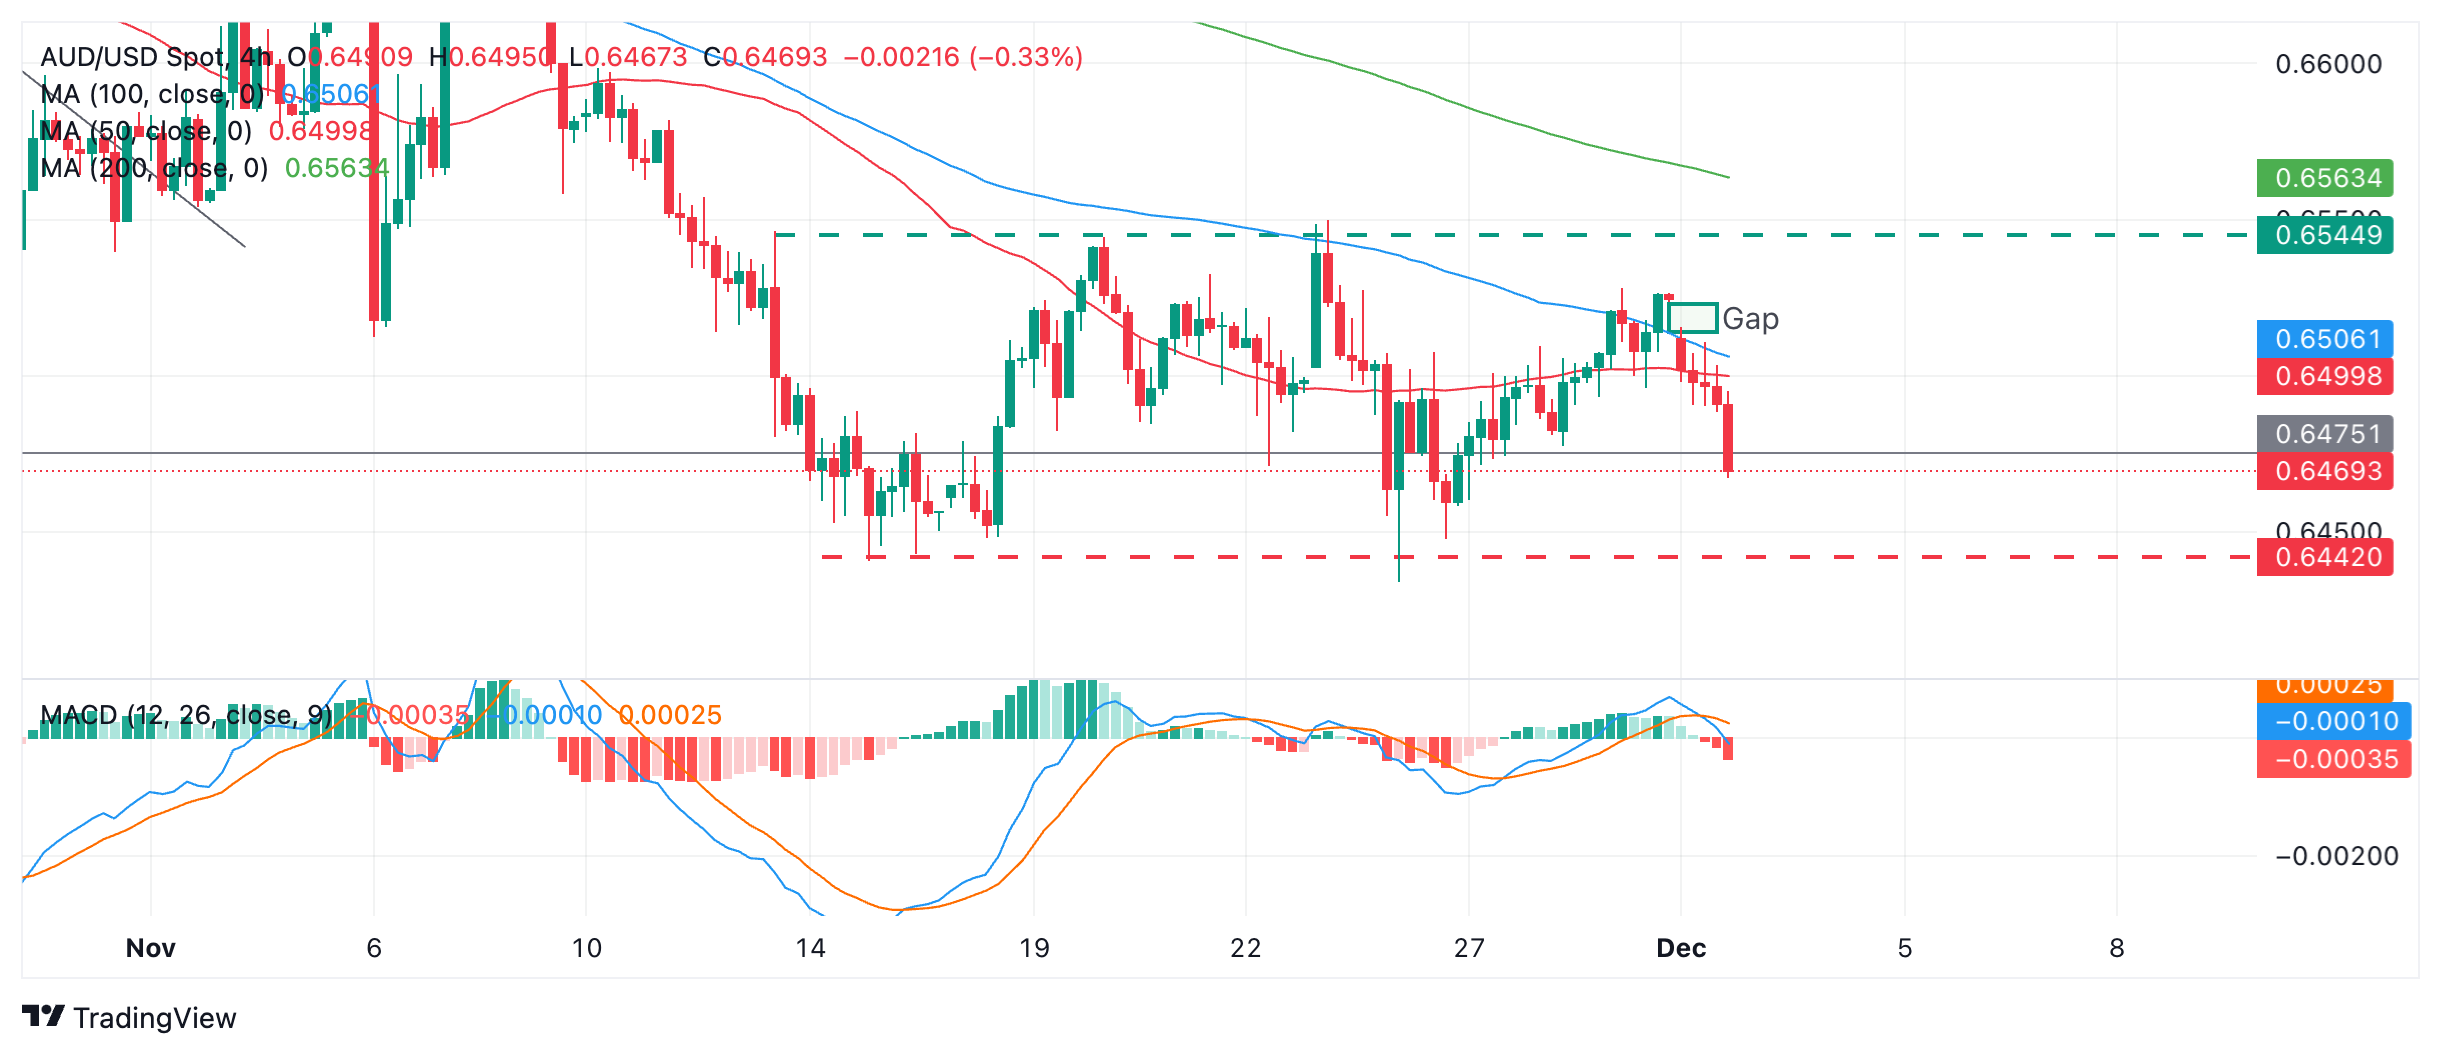
At the start of trading on Monday the pair opened a gap between between 0.6515 and 0.6524 (green rectangle). It has been selling off ever since. 

AUD/USD will probably eventually fill the gap since technical analysis theory says that “the market abhors a gap”. This means gaps do not tend to remain open. When they occur within a sideways market they usually close more quickly.

It is possible the Aussie pair might fall to the region of the range lows in the 0.6440s first before recovering and filling the open gap. 

Alternatively it may stop falling before it reaches the bottom of the range and recover. At the moment there are no signs of the selling letting up. 

The (blue) Moving Average Convergence Divergence (MACD) indicator has crossed below its red signal line, which is a sell signal and reinforces the case for price falling towards the range lows.

Author

Joaquin Monfort

Joaquin Monfort is a financial writer and analyst with over 10 years experience writing about financial markets and alt data. He holds a degree in Anthropology from London University and a Diploma in Technical analysis.

More from Joaquin Monfort
Share:

Markets move fast. We move first.

Orange Juice Newsletter brings you expert driven insights - not headlines. Every day on your inbox.

By subscribing you agree to our Terms and conditions.

Editor's Picks

EUR/USD clings to small gains near 1.1750

Following a short-lasting correction in the early European session, EUR/USD regains its traction and clings to moderate gains at around 1.1750 on Monday. Nevertheless, the pair's volatility remains low, with investors awaiting this weeks key data releases from the US and the ECB policy announcements.

GBP/USD edges higher toward 1.3400 ahead of US data and BoE

GBP/USD reverses its direction and advances toward 1.3400 following a drop to the 1.3350 area earlier in the day. The US Dollar struggles to gather recovery momentum as markets await Tuesday's Nonfarm Payrolls data, while the Pound Sterling holds steady ahead of the BoE policy announcements later in the week.

Gold pulls away from session high, holds above $4,300

Gold loses its bullish momentum and retreats below $4,350 after testing this level earlier on Monday. XAU/USD, however, stays in positive territory as the US Dollar remains on the back foot on growing expectations for a dovish Fed policy outlook next year.

Solana consolidates as spot ETF inflows near $1 billion signal institutional dip-buying

Solana price hovers above $131 at the time of writing on Monday, nearing the upper boundary of a falling wedge pattern, awaiting a decisive breakout. On the institutional side, demand for spot Solana Exchange-Traded Funds remained firm, pushing total assets under management to nearly $1 billion since launch. 

Big week ends with big doubts

The S&P 500 continued to push higher yesterday as the US 2-year yield wavered around the 3.50% mark following a Federal Reserve (Fed) rate cut earlier this week that was ultimately perceived as not that hawkish after all. The cut is especially boosting the non-tech pockets of the market.

Solana Price Forecast: SOL consolidates as spot ETF inflows near $1 billion signal institutional dip-buying

Solana (SOL) price hovers above $131 at the time of writing on Monday, nearing the upper boundary of a falling wedge pattern, awaiting a decisive breakout.