AUD/USD Price Analysis: Portrays pre-NFP consolidation above 0.6650


  • AUD/USD picks up bids to refresh intraday high, snaps three-day losing streak.
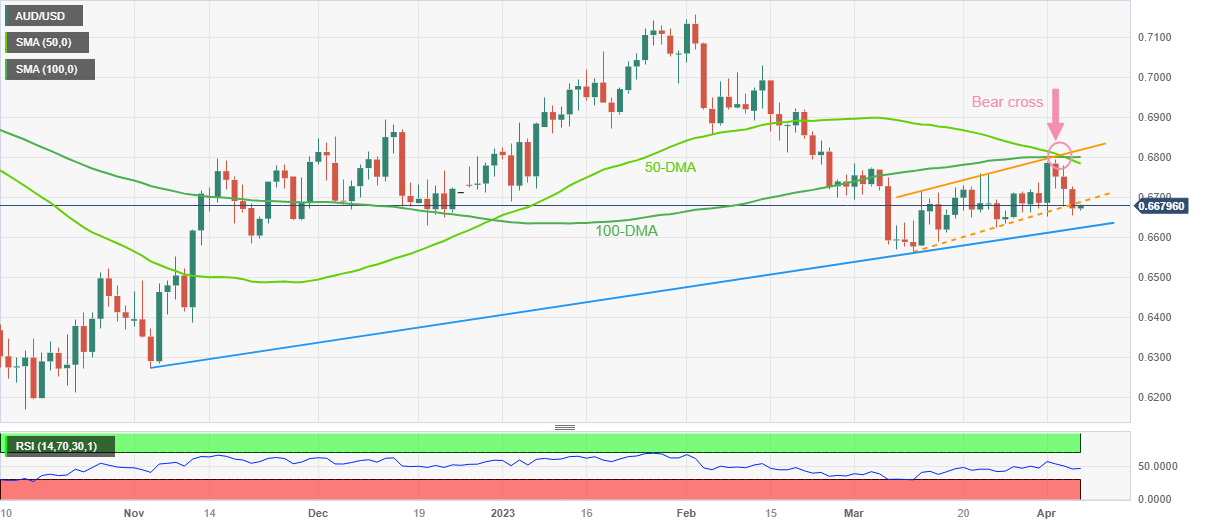
  • Clear break of one-month-old ascending trend channel, bearish moving average crossover keeps sellers hopeful.
  • US NFP may bolster recession woes and weigh on prices on matching downbeat forecasts.

AUD/USD pares weekly losses around 0.6680 as traders prepare for the US Nonfarm Payrolls (NFP) during Good Friday’s holiday-driven sluggish session. In doing so, the Aussie pair prints the first daily gains in four amid upbeat headlines from Australia’s major customer China.

Also read: China’s SAFE: Will fend off external financial market shocks and risks

However, the Reserve Bank of Australia’s (RBA) dovish play joins the recession woes and exerts downside pressure on the AUD/USD prices.

Also read: AUD/USD justifies risk-barometer status around 0.6670 as recession woes loom, US NFP eyed

Technically, the Aussie pair’s rejection of a one-month-old bullish channel and a bearish moving average crossover, signaled by the 50-DMA’s piercing of the 100-DMA from above, keep the AUD/USD sellers hopeful. Adding strength to the downside bias is the steady RSI (14) line.

That said, the quote’s latest rebound remains elusive unless it stays below the aforementioned channel’s lower line, close to 0.6690 by the press time.

Apart from the 0.6690 immediate hurdle, the 0.6700 round figure can also test the pair buyers before giving them control.

Even so, the 50-DMA, the 100-DMA and the top line of the stated channel, around 0.6785, 0.6800 and 0.6820 in that order, can challenge the AUD/USD buyers afterward.

Alternatively, an upward-sloping support line from the last November, close to 0.6620 by the press time, puts a floor under the AUD/USD prices.

Following that, the previous monthly low of 0.6564, also the Year-To-Date (YTD) bottom, will gain the market’s attention.

AUD/USD: Daily chart           

Trend: Further upside expected

Additional important levels

Overview
Today last price 0.668
Today Daily Change 0.0008
Today Daily Change % 0.12%
Today daily open 0.6672
 
Trends
Daily SMA20 0.6684
Daily SMA50 0.6792
Daily SMA100 0.68
Daily SMA200 0.6748
 
Levels
Previous Daily High 0.6725
Previous Daily Low 0.6653
Previous Weekly High 0.6738
Previous Weekly Low 0.6634
Previous Monthly High 0.6784
Previous Monthly Low 0.6564
Daily Fibonacci 38.2% 0.6681
Daily Fibonacci 61.8% 0.6698
Daily Pivot Point S1 0.6642
Daily Pivot Point S2 0.6611
Daily Pivot Point S3 0.6569
Daily Pivot Point R1 0.6714
Daily Pivot Point R2 0.6756
Daily Pivot Point R3 0.6786


Share: Feed news

Information on these pages contains forward-looking statements that involve risks and uncertainties. Markets and instruments profiled on this page are for informational purposes only and should not in any way come across as a recommendation to buy or sell in these assets. You should do your own thorough research before making any investment decisions. FXStreet does not in any way guarantee that this information is free from mistakes, errors, or material misstatements. It also does not guarantee that this information is of a timely nature. Investing in Open Markets involves a great deal of risk, including the loss of all or a portion of your investment, as well as emotional distress. All risks, losses and costs associated with investing, including total loss of principal, are your responsibility. The views and opinions expressed in this article are those of the authors and do not necessarily reflect the official policy or position of FXStreet nor its advertisers. The author will not be held responsible for information that is found at the end of links posted on this page.

If not otherwise explicitly mentioned in the body of the article, at the time of writing, the author has no position in any stock mentioned in this article and no business relationship with any company mentioned. The author has not received compensation for writing this article, other than from FXStreet.

FXStreet and the author do not provide personalized recommendations. The author makes no representations as to the accuracy, completeness, or suitability of this information. FXStreet and the author will not be liable for any errors, omissions or any losses, injuries or damages arising from this information and its display or use. Errors and omissions excepted.

The author and FXStreet are not registered investment advisors and nothing in this article is intended to be investment advice.

Recommended content


Recommended content

Editors’ Picks

EUR/USD consolidates below 1.0900 following Wednesday's rally

EUR/USD consolidates below 1.0900 following Wednesday's rally

EUR/USD trades in a tight range below 1.0900 after registering impressive gains on Wednesday. The US Dollar struggles to stage a rebound following the CPI-inspired selloff as investors await mid-tier data releases and comments from Fed officials.

EUR/USD News

GBP/USD corrects lower after testing 1.2700

GBP/USD corrects lower after testing 1.2700

Following Wednesday's upsurge, GBP/USD stretched higher and touched a fresh multi-week high at 1.2700 in the Asian session on Thursday. With the market focus shifting to US Jobless Claims data, the pair corrects lower in the European trading hours. 

GBP/USD News

Gold price drifts higher as US CPI inflation fuels Fed rate cuts

Gold price drifts higher as US CPI inflation fuels Fed rate cuts

The Gold price gains traction amid the weaker US Dollar on Thursday. The recent CPI report showed inflation in the US slowed in April, prompting market players to increase their bets on the US Fed rate cuts this year.

Gold News

DOGE’s 15% upside potential hinges on Bitcoin holding above $65K

DOGE’s 15% upside potential hinges on Bitcoin holding above $65K

Dogecoin price is trading with a bullish bias, leading meme coins north as sector bulls resurface. This show of hand comes after Bitcoin price broke past the $65,000 threshold and could extend if the pioneer cryptocurrency holds above this level.

Read more

Dow Jones Industrial Average soars 350 points, sets new all-time high as rate cut hopes surge

Dow Jones Industrial Average soars 350 points, sets new all-time high as rate cut hopes surge

The Dow Jones Industrial Average clipped into a fresh all-time high on Wednesday, gaining almost nine-tenths of a percent during the US market session after US Consumer Price Index inflation slipped further back.

Read more

Forex MAJORS

Cryptocurrencies

Signatures