AUD/USD Price Analysis: Eyes a test of 200-day EMA on conquering 0.6700 resistance


  • Quiet market mood on account of Thanksgiving Day has turned the Aussie asset sideways.
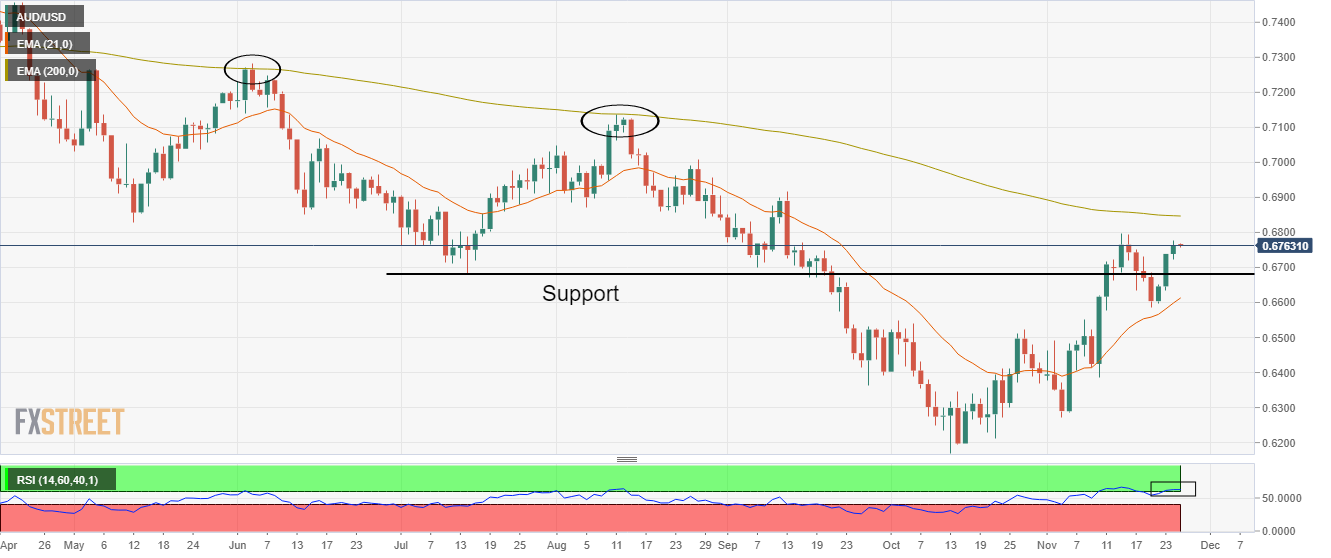
  • An establishment of the AUD/USD pair above 0.6700 has strengthened the Australian Dollar.
  • The 200-EMA at 0.6847 is expected to be smashed by the major sooner.

The AUD/USD pair is displaying back-and-forth moves in a 10-pips range in the early Asian session. The Aussie asset has turned sideways after printing a fresh weekly high at 0.6778 amid a quiet market mood on account of Thanksgiving Day.

Meanwhile, the USD Index (DXY) is still in the hangover of ‘less-hawkish’ cues from the Federal Open Market Committee (FOMC) minutes. The US Dollar is hovering below the critical hurdle of 106.00 amid the risk appetite theme.

On a daily scale, the Aussie asset has confidently established above the horizontal support plotted near July 14 low around 0.6700. The next hurdle for the Aussie asset is the 200-period Exponential Moving Average (EMA) at 0.6847, which has remained a major ceiling.

The 20-period EMA at 0.6616 is scaling higher, which adds to the upside filters.

Meanwhile, the Relative Strength Index (RSI) (14) is focusing on shifting into the bullish range of 60.00-80.00, which will trigger a bullish momentum.

Going forward, a break above Thursday’s high at 0.6778 will extend the three-day winning streak, which will drive the asset toward the round-level resistance at 0.6800, followed by the 200-EMA at 0.6847.

On the flip side, the Australian Dollar could lose strength if the Aussie asset drops below Monday’s low at 0.6585. This will drag the major towards October 4 high at 0.6548 and November 2 high at 0.6493.

AUD/USD hourly chart

AUD/USD

Overview
Today last price 0.6762
Today Daily Change 0.0023
Today Daily Change % 0.34
Today daily open 0.6739
 
Trends
Daily SMA20 0.6553
Daily SMA50 0.6487
Daily SMA100 0.6691
Daily SMA200 0.694
 
Levels
Previous Daily High 0.6739
Previous Daily Low 0.6634
Previous Weekly High 0.6798
Previous Weekly Low 0.6634
Previous Monthly High 0.6548
Previous Monthly Low 0.617
Daily Fibonacci 38.2% 0.6699
Daily Fibonacci 61.8% 0.6674
Daily Pivot Point S1 0.6669
Daily Pivot Point S2 0.6599
Daily Pivot Point S3 0.6565
Daily Pivot Point R1 0.6774
Daily Pivot Point R2 0.6808
Daily Pivot Point R3 0.6878


Share: Feed news

Information on these pages contains forward-looking statements that involve risks and uncertainties. Markets and instruments profiled on this page are for informational purposes only and should not in any way come across as a recommendation to buy or sell in these assets. You should do your own thorough research before making any investment decisions. FXStreet does not in any way guarantee that this information is free from mistakes, errors, or material misstatements. It also does not guarantee that this information is of a timely nature. Investing in Open Markets involves a great deal of risk, including the loss of all or a portion of your investment, as well as emotional distress. All risks, losses and costs associated with investing, including total loss of principal, are your responsibility. The views and opinions expressed in this article are those of the authors and do not necessarily reflect the official policy or position of FXStreet nor its advertisers. The author will not be held responsible for information that is found at the end of links posted on this page.

If not otherwise explicitly mentioned in the body of the article, at the time of writing, the author has no position in any stock mentioned in this article and no business relationship with any company mentioned. The author has not received compensation for writing this article, other than from FXStreet.

FXStreet and the author do not provide personalized recommendations. The author makes no representations as to the accuracy, completeness, or suitability of this information. FXStreet and the author will not be liable for any errors, omissions or any losses, injuries or damages arising from this information and its display or use. Errors and omissions excepted.

The author and FXStreet are not registered investment advisors and nothing in this article is intended to be investment advice.

Recommended content


Recommended content

Editors’ Picks

EUR/USD clings to gains above 1.0750 after US data

EUR/USD clings to gains above 1.0750 after US data

EUR/USD manages to hold in positive territory above 1.0750 despite retreating from the fresh multi-week high it set above 1.0800 earlier in the day. The US Dollar struggles to find demand following the weaker-than-expected NFP data.

EUR/USD News

GBP/USD declines below 1.2550 following NFP-inspired upsurge

GBP/USD declines below 1.2550 following NFP-inspired upsurge

GBP/USD struggles to preserve its bullish momentum and trades below 1.2550 in the American session. Earlier in the day, the disappointing April jobs report from the US triggered a USD selloff and allowed the pair to reach multi-week highs above 1.2600.

GBP/USD News

Gold struggles to hold above $2,300 despite falling US yields

Gold struggles to hold above $2,300 despite falling US yields

Gold stays on the back foot below $2,300 in the American session on Friday. The benchmark 10-year US Treasury bond yield stays in negative territory below 4.6% after weak US data but the improving risk mood doesn't allow XAU/USD to gain traction.

Gold News

Bitcoin Weekly Forecast: Should you buy BTC here? Premium

Bitcoin Weekly Forecast: Should you buy BTC here?

Bitcoin (BTC) price shows signs of a potential reversal but lacks confirmation, which has divided the investor community into two – those who are buying the dips and those who are expecting a further correction.

Read more

Week ahead – BoE and RBA decisions headline a calm week

Week ahead – BoE and RBA decisions headline a calm week

Bank of England meets on Thursday, unlikely to signal rate cuts. Reserve Bank of Australia could maintain a higher-for-longer stance. Elsewhere, Bank of Japan releases summary of opinions.

Read more

Forex MAJORS

Cryptocurrencies

Signatures