AUD/USD Price Analysis: Divergence confluence sealed the deal for the bears
- AUD/USD sinks below key hourly trendline support following series of multi time frame bearish divergences.
- A downside target is now located at the -272% Fibonacci retracement of the current correction's range.

As per the prior analysis, AUD/USD Price Analysis: Hidden bearish divergence into the Employment data, AUD/USD has taken the bearish route and the divergence has played a role.
As illustrated ahead of the Employment report on Wednesday, the hidden bearish divergence was highlighted as follows:
AUD/USD hourly chart
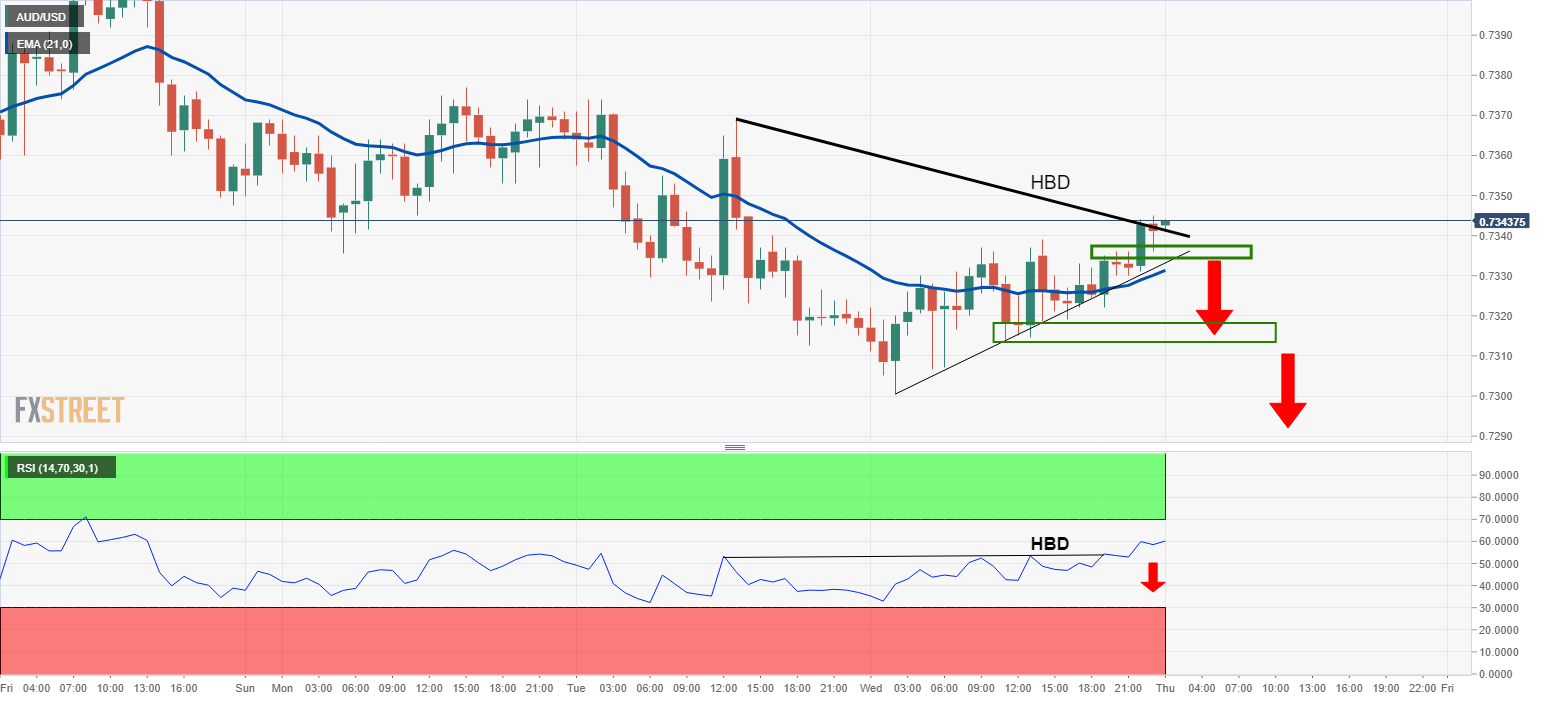
It was explained that ''the hidden bearish divergence is something that traders should be aware of in case there is a short to the downside.
The HBD will offer additional conviction to those seeking to short the Aussie should there be a disappointment in the data.
0.7320 will be key in this regard as it is the last defence following a potential trendline support break and a break there opens risk to a significant downside continuation in the coming sessions.''
AUD/USD, live market
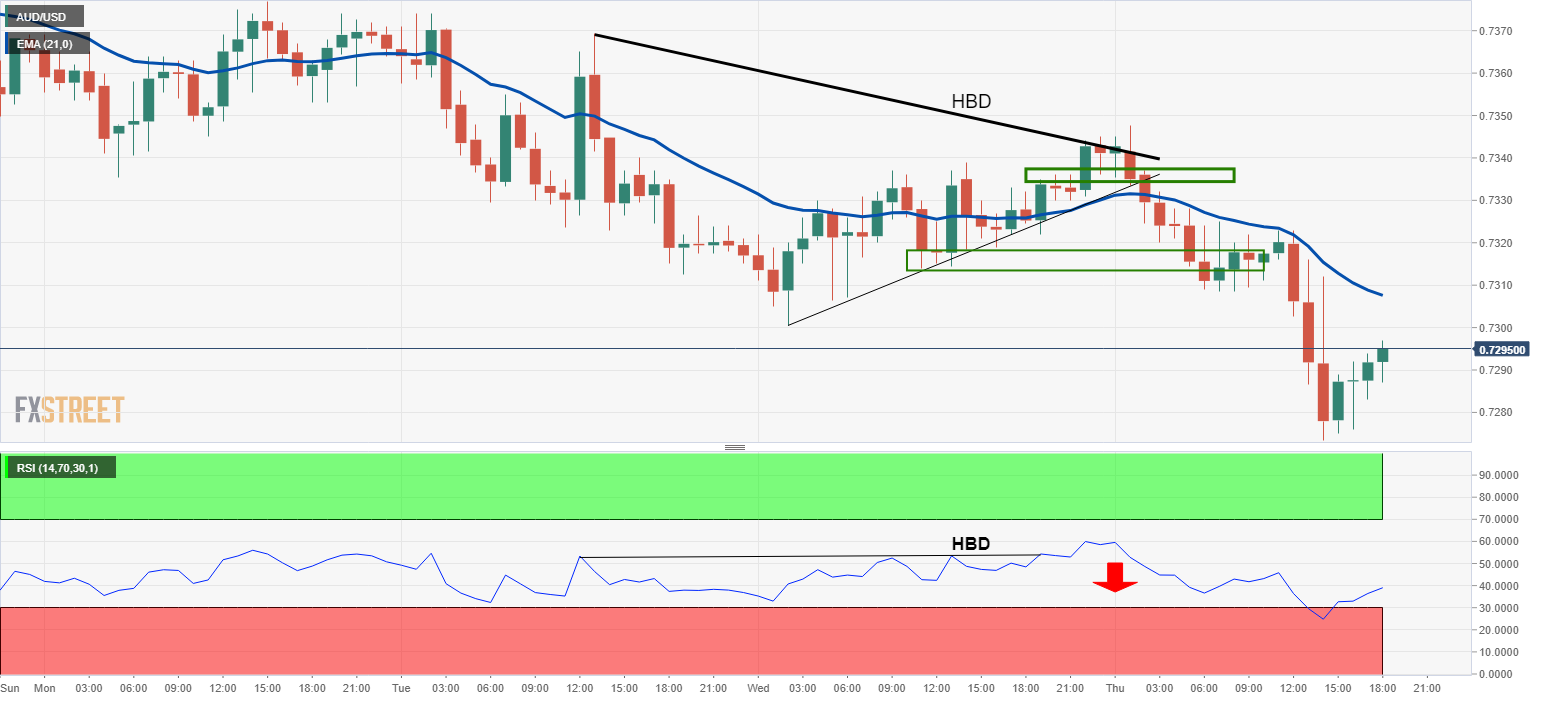
As illustrated, the price has fallen, respecting the levels of support on the way down.
What is also important to note, on the lower time frames, we had a confluence with the hourly hidden bearish divergences, making for a powerful bearish trend with plenty of momentum as follows:
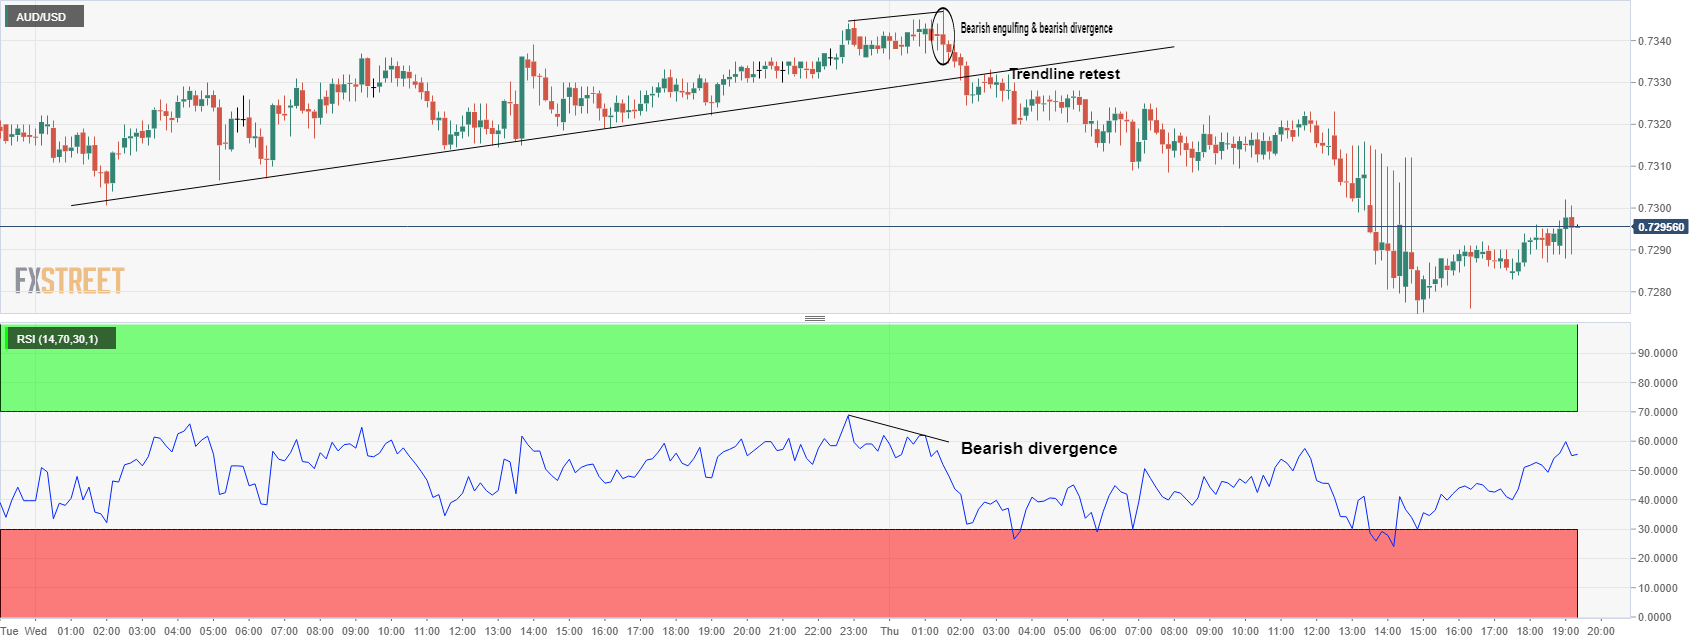
AUD/USD, hourly live chart
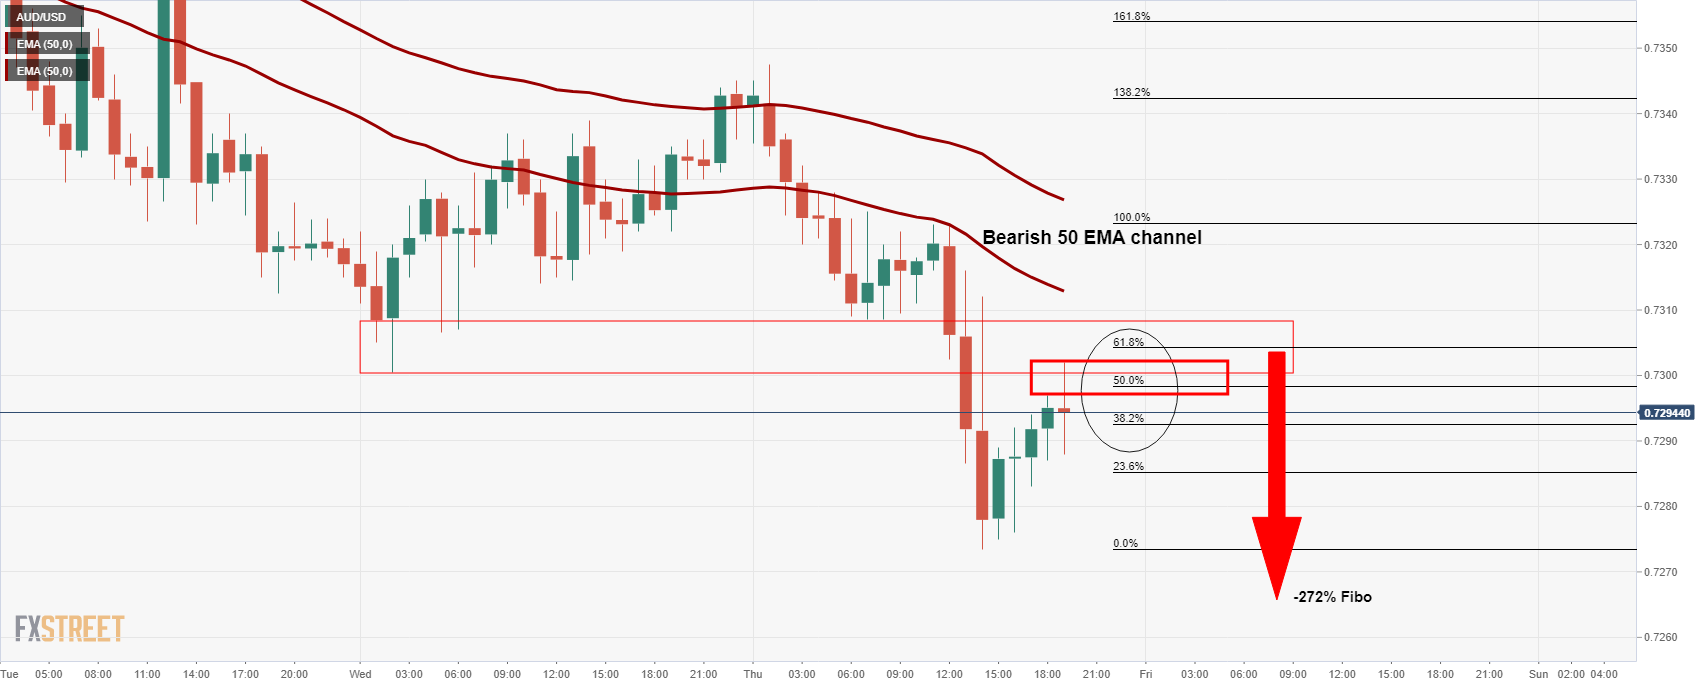
With the price below the bearish 50 EMA channel, there are bearish prospects from a restest of the Fibonacci ratios, as illustrated above as the price drifts higher in a gradual and decelerating correction.
A downside target is located at the -272% Fibonacci retracement of the current correction's range near 0.7265.
Author

Ross J Burland
FXStreet
Ross J Burland, born in England, UK, is a sportsman at heart. He played Rugby and Judo for his county, Kent and the South East of England Rugby team.


