|

AUD/USD Price Analysis: Bulls retreat from 0.6825-20 hurdle

  • AUD/USD pares intraday losses at the highest levels in 12 days.
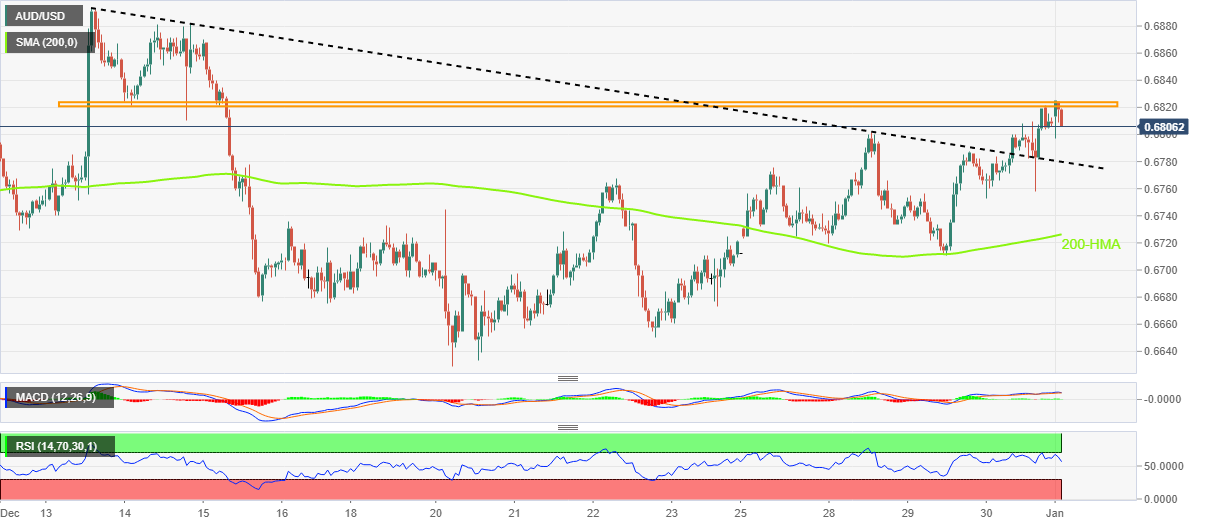
  • Sluggish RSI, MACD signals also favor pullback moves targeting previous resistance from mid-December.
  • 200-SMA adds to the downside filters, bulls need validation from previous monthly high to keep the reins.

AUD/USD retreats from the short-term key resistance during Monday’s Asian session as bulls take a breather after a three-day uptrend. In doing so, the Aussie pair steps back from a three-week-old horizontal resistance amid nearly overbought RSI and sluggish MACD signals.

It’s worth noting, however, that the previous week’s successful upside break of a descending trend line from November 13, close to 0.6780 by the press time, keeps the AUD/USD buyers hopeful.

Even if the quote breaks the 0.6780 support, the 200-HMA level surrounding 0.6725 acts as the last defense of the AUD/USD buyers before giving control to the Aussie pair sellers.

In that case, the Aussie pair bears could quickly aim for the previous monthly low near 0.6690.

On the contrary, a successful upside break of the three-week-old horizontal resistance area surrounding 0.6820-25 could propel the pair towards the previous monthly high surrounding 0.6895.

Following that, the pair’s successful trading beyond the 0.6900 round figure, as well as September’s high near 0.6920, becomes necessary for the AUD/USD bulls to aim for an August 2022 high of around 0.7135.

Overall, AUD/USD remains on the buyer’s radar but the upside room appears limited.

AUD/USD: Hourly chart

Trend: Pullback expected

Additional important levels

Overview
Today last price0.6814
Today Daily Change0.0006
Today Daily Change %0.09%
Today daily open0.6808
 
Trends
Daily SMA200.6738
Daily SMA500.6645
Daily SMA1000.6642
Daily SMA2000.6863
 
Levels
Previous Daily High0.6821
Previous Daily Low0.6753
Previous Weekly High0.6821
Previous Weekly Low0.671
Previous Monthly High0.6893
Previous Monthly Low0.6629
Daily Fibonacci 38.2%0.6795
Daily Fibonacci 61.8%0.6779
Daily Pivot Point S10.6767
Daily Pivot Point S20.6726
Daily Pivot Point S30.6698
Daily Pivot Point R10.6835
Daily Pivot Point R20.6863
Daily Pivot Point R30.6904

Author

Anil Panchal

Anil Panchal

FXStreet

Anil Panchal has nearly 15 years of experience in tracking financial markets. With a keen interest in macroeconomics, Anil aptly tracks global news/updates and stays well-informed about the global financial moves and their implications.

More from Anil Panchal
Share:

Editor's Picks

EUR/USD eases marginally, back to 1.1800

EUR/USD navigates a narrow range on Thursday, hovering around the 1.1800 neighbourhood in a context of humble gains in the US Dollar. The pair’s lacklustre performance come amid the unabated trade uncertainty, geopolitical tensions in the Middle East and the cautious tone from the ECB’s Lagarde.

GBP/USD retreats from tops, approaching 1.3540

GBP/USD partially sets aside Wednesday’s strong advance and recedes to the 1.3540 region on Thursday. Cable’s modest retracement follows the equally acceptable gains in the Greenback, while investors continue to pencil in a potential BoE rate cut in March.

Gold clings to gains just below $5,200, focus on geopolitics

Gold is edging modestly higher on Thursday, adding to Wednesday’s uptick and holding just below the $5,200 mark per troy ounce against the backdrop of modest gains in the US Dollar. In the meantime, attention is turning to the geopolitical scenario following US-Iran nuclear talks.

Stellar: Relief bounce fades as bearish undertone persists

Stellar is trading around $0.16 at the time of writing on Thursday after rebounding more than 8% in the previous day. Derivatives data paints a negative picture as XLM’s short bets hit a monthly high while Open Interest continues to decline.

The one thing everyone is on the lookout for is US action of some sort against Iran

The FX market is minestrone soup these days. It is befuddled by conflicting data, rumors and small stories exaggerated out of proportion, and Trump-generated uncertainty. 

Solana strikes key resistance with double-digit gains

Solana trades at $88 at press time on Thursday, after an 11% upswing the previous day within a broader consolidation range of roughly three weeks. Institutional demand for Solana heightens as US spot SOL Exchange Traded Funds record $30 million of inflow on Wednesday.