|

AUD/USD Price Analysis: Bounces off lows, not out of the woods yet

  • AUD/USD trimmed a part of its intraday losses amid a modest USD pullback.
  • The near-term technical bias remains tilted firmly in favour of bearish traders.
  • A  sustained move beyond the 0.7765-75 region will negate the negative bias.

The AUD/USD pair quickly recovered around 35 pips from daily swing lows and was last seen trading with only modest losses, around the 0.7670 region.

The US dollar trimmed a part of its intraday gains to three-and-half-month tops and extended some support to the AUD/USD pair. Apart from this, a sudden pick up in the US equity futures provided an additional boost to the perceived riskier aussie.

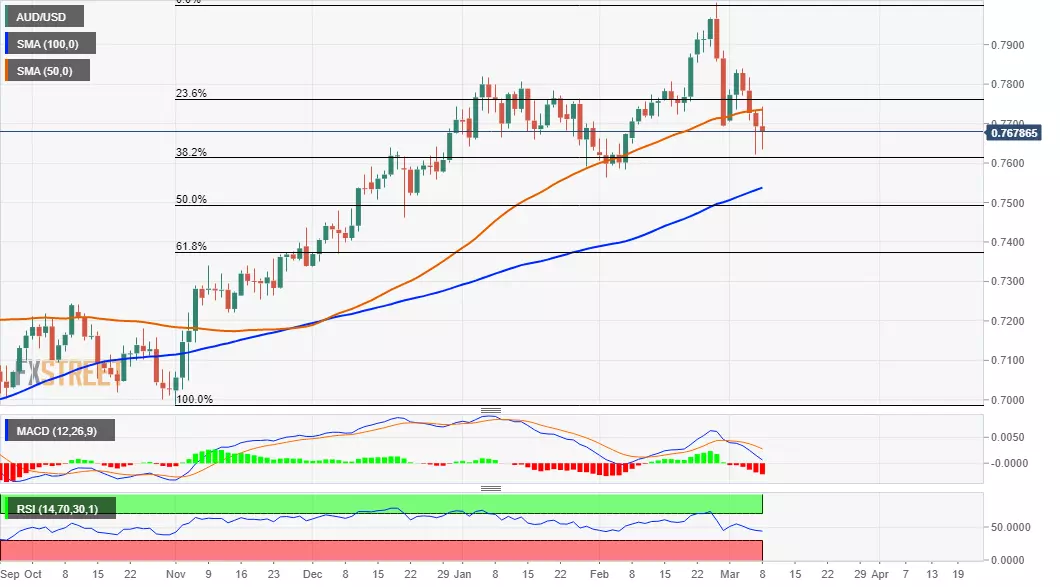
From a technical perspective, the pair once again attracted some buying ahead of the 38.2% Fibonacci level of the 0.7027-0.8008 positive move. The mentioned support is pegged near the 0.7620 region and should now act as a key pivotal point for traders.

Given Friday's sustained break below 50-day SMA, the near-term bias might have shifted in favour of bearish traders. The negative outlook is reinforced by the fact that oscillators on the daily chart have just started drifting into the bearish territory.

Sustained weakness below the 38.2% Fibo. support will reaffirm the bearish bias and pave the way for an extension of the recent retracement slide from the key 0.8000 psychological mark. The AUD/USD pair might then turn vulnerable to break below the 0.7600 mark.

The downward trajectory could then get extended towards testing 100-day SMA support, currently near the 0.7545-40 region. The AUD/USD pair could eventually drop to the 50% Fibo. level, around the key 0.7500 psychological mark.

On the flip side, the 50-DMA, coinciding with the daily swing highs, around the 0.7740-45 region, should now act as a strong resistance. This is closely followed by 23.6% Fibo. level resistance near the 0.7765-75 congestion zone.

A convincing breakthrough will negate any near-term negative bias and prompt some short-covering move. The subsequent positive move has the potential to lift the AUD/USD pair back above the 0.7800 mark, towards testing the 0.7830-40 supply zone.

AUD/USD daily chart

fxsoriginal

Technical levels to watch

AUD/USD

Overview
Today last price0.7676
Today Daily Change-0.0017
Today Daily Change %-0.22
Today daily open0.7693
 
Trends
Daily SMA200.7788
Daily SMA500.7734
Daily SMA1000.7532
Daily SMA2000.7314
 
Levels
Previous Daily High0.7732
Previous Daily Low0.7622
Previous Weekly High0.7838
Previous Weekly Low0.7622
Previous Monthly High0.8008
Previous Monthly Low0.7562
Daily Fibonacci 38.2%0.7664
Daily Fibonacci 61.8%0.769
Daily Pivot Point S10.7632
Daily Pivot Point S20.7572
Daily Pivot Point S30.7522
Daily Pivot Point R10.7743
Daily Pivot Point R20.7793
Daily Pivot Point R30.7853

Author

Haresh Menghani

Haresh Menghani is a detail-oriented professional with 10+ years of extensive experience in analysing the global financial markets.

More from Haresh Menghani
Share:

Editor's Picks

EUR/USD remains heavy near 1.1600 after hot EU inflation data

EUR/USD remains heavily offered near 1.1600, six-week lows, in the European session on Tuesday. The pair fails to find any inspiration from a surprise pick up in Eurozone inflation for February, as the US Dollar continues to attract safe haven flows amid escalating geopolitical tensions in the Middle East. 

GBP/USD attacks 1.3300, refreshing three-month lows

GBP/USD is deep in the red near 1.3300, accelerating its downside to renew three-month lows in European trading on Tuesday. The ongoing escalation in the Iran war, combined with rising Oil prices, weighs negatively on the higher-yielding Pound Sterling as the US Dollar capitalizes on increased haven demand.

Gold falls below $5,300 as stronger USD counter Middle East woes

Gold attracts some intraday selling and falls below $5,300 on Tuesday. The US Dollar climbs to a fresh high since January 20 and turns out to be a key factor exerting downward pressure on the commodity. However, concerns about a broader regional conflict in the Middle East continue to weigh on investors' sentiment and underpin demand for the traditional safe-haven bullion.

Stellar risks deeper losses as derivatives metrics turn negative

Stellar is trading red below $0.16 at the time of writing on Tuesday, after a slight recovery the previous day. Weakening derivatives data caps the recovery, while an unfavorable technical outlook projects a deeper correction for the XLM token in the upcoming days.

Middle East conflict ramps up a gear as energy price spike rips through markets

It’s another risk off day as geopolitical headwinds continue to batter financial markets. Although markets calmed during the US session and US stocks managed to post gains on Monday, this has not fed through to the European session, and stocks and bonds are sharply lower for a second day.

Hyperliquid Price Forecast: HYPE rises on commodities demand amid US-Iran war

Hyperliquid (HYPE) steadies above $33 at press time on Tuesday, marking its fourth consecutive day of recovery in a broadly volatile market due to the ongoing US-Israel strikes on Iran.