|

AUD/USD Price Analysis: Bears seek validation from 0.6430 support

  • AUD/USD holds lower ground near intraday bottom, keeps latest pullback from three-week high.
  • Bearish MACD signals, clear U-turn from the key resistance lines keep sellers hopeful.
  • 100-SMA could probe bears on the way to yearly low.

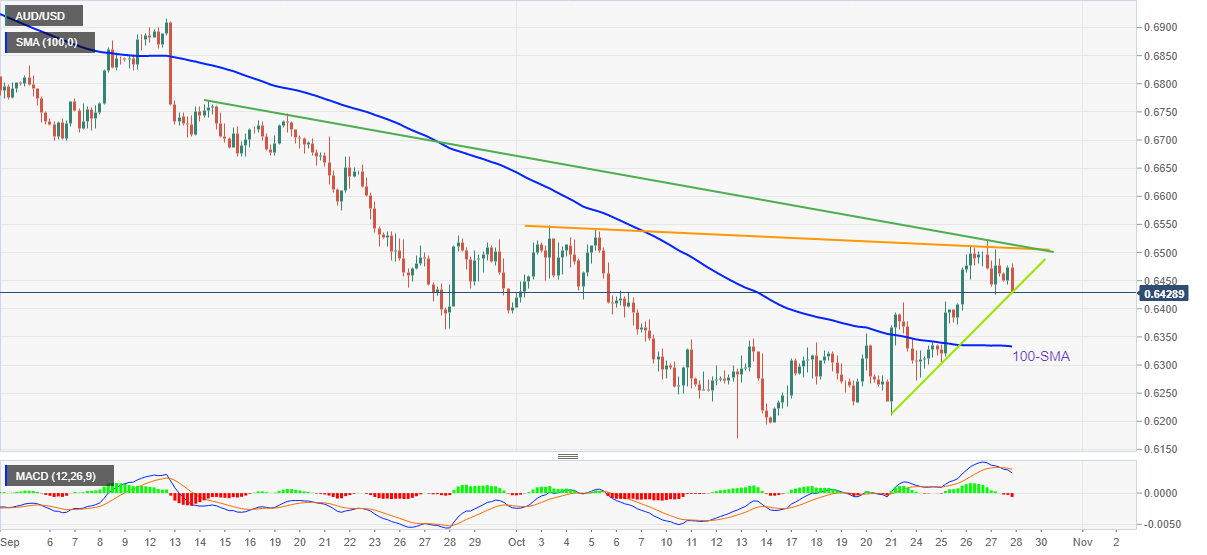
AUD/USD sellers poke the weekly support line near the intraday low surrounding 0.6430. In doing so, the Aussie pair prints the second consecutive intraday loss during early Friday morning in Europe.

Given the bearish MACD signals, as well as the pair’s sustained pullback from the six-week-old and three-week-long resistance lines near 0.6500, the AUD/USD prices are likely to break the immediate support line near 0.6430.

Following that, the 100-SMA support level near the 0.6330 and the 0.6300 round figure may test the AUD/USD bears before directing them to the yearly low surrounding 0.6170.

Alternatively, a confluence of the aforementioned resistance lines around 0.6500 appears a tough nut to crack for the AUD/USD buyers, a break of which could quickly propel the prices towards the monthly high near 0.6550.

In a case where AUD/USD buyers keep the reins past 0.6550, the mid-September highs near 0.6770 could gain the market’s attention ahead of the previous monthly peak of 0.6915. If the quote remains firmer past 0.6915, the 0.7000 psychological magnet will be crucial to track.

Overall, AUD/USD remains on the bear’s radar even as a short-term rebound can’t be ruled out.

AUD/USD: Four-hour chart
Trend: Further downside expected

Additional important levels

Overview
Today last price0.6436
Today Daily Change-0.0017
Today Daily Change %-0.26%
Today daily open0.6453
 
Trends
Daily SMA200.6361
Daily SMA500.6594
Daily SMA1000.6759
Daily SMA2000.6994
 
Levels
Previous Daily High0.6522
Previous Daily Low0.6426
Previous Weekly High0.6393
Previous Weekly Low0.6197
Previous Monthly High0.6916
Previous Monthly Low0.6363
Daily Fibonacci 38.2%0.6463
Daily Fibonacci 61.8%0.6485
Daily Pivot Point S10.6412
Daily Pivot Point S20.6371
Daily Pivot Point S30.6315
Daily Pivot Point R10.6508
Daily Pivot Point R20.6563
Daily Pivot Point R30.6604

Author

Anil Panchal

Anil Panchal

FXStreet

Anil Panchal has nearly 15 years of experience in tracking financial markets. With a keen interest in macroeconomics, Anil aptly tracks global news/updates and stays well-informed about the global financial moves and their implications.


More from Anil Panchal
Share:

Editor's Picks

GBP/USD sticks to red near 1.3650, eyes on Iran sanctions

GBP/USD trades with a negative bias around mid-1.3600s at the start of a new week on Monday. The US Dollar recovers ground due to uncertainty over potential US economic sanctions on Iran, leaving the risk-sensitive British Pound on the backfoot.

EUR/USD stays defensive below 1.1700 amid cautious markets

EUR/USD is trading defensively below 1.1700 in Monday's European trading. The pair struggles as the US Dollar attempts a tepid recovery following last week's US Treasury bond buyback plan-led sell-off. Markets remain unnerved amid US threats to impose economic sanctions on Iran, the details of which are expected to be announced later in the day.

Gold sits at three-month highs near $4,650

Gold is sitting close to its highest level in three months, near $4,650, in the European session on Monday. The precious metal capitalizes on persistent US Dollar weakness, following the US Treasury's buyback plan amid fresh US-Canada trade tensions. Traders await Iran sanction details for further impetus.

Here's what I learned trading meme coins
I’ve been trading cryptocurrencies for the past seven years, with meme coins becoming one of the most exciting and implacable parts of my experience. I love them because they represent internet culture and community sentiment, and, let’s be honest, extreme speculation. Newly launched meme coins were especially tempting: get in early enough, I thought, and a small bet could turn into a huge return.
The week ahead: Jackson Hole and Nvidia results to take focus away from Trump
We start the week with the focus squarely on the US. Rising Treasury yields, the Jackson Hole Symposium, inflation and GDP data, along with tariff risks, will dominate market action in the coming days.
$20 billion offered, $2 billion taken: Why Treasury doubled its buyback cap

The US Treasury moved off its own calendar on Wednesday, and that is the part worth sitting with. At 12:32 GMT, the department said it would at least double the size of liquidity support buyback operations in the 10-year to 20-year and 20-year to 30-year sectors, lifting the maximum from $2 billion per operation to at least $4 billion, effective September 9 and running to November 4.