|

AUD/USD Price Analysis: Bears await sustained break and acceptance below 0.6500 mark

  • AUD/USD meets with a fresh supply on Friday and drops back closer to the weekly low.
  • Weaker Chinese trade data undermine the Aussie amid strong follow-through USD buying.
  • The technical setup favours bearish traders and supports prospects for additional losses.

The AUD/USD pair comes under some renewed selling pressure on Friday and extends its steady intraday descent through the early part of the European session. Spot prices touch a fresh daily low following the release of weaker Chinese trade data, albeit manage to hold above the 0.6500 psychological mark and rebound a few pips in the last hour.

Any meaningful recovery, however, still seems elusive in the wake of strong follow-through US Dollar (USD) buying, bolstered by expectations that the Federal Reserve (Fed) will keep interest rates higher for longer amid sticky US inflation. Apart from this, persistent geopolitical tensions stemming from conflicts in the Middle East benefit the safe-haven Greenback and might further contribute to capping the risk-sensitive Aussie.

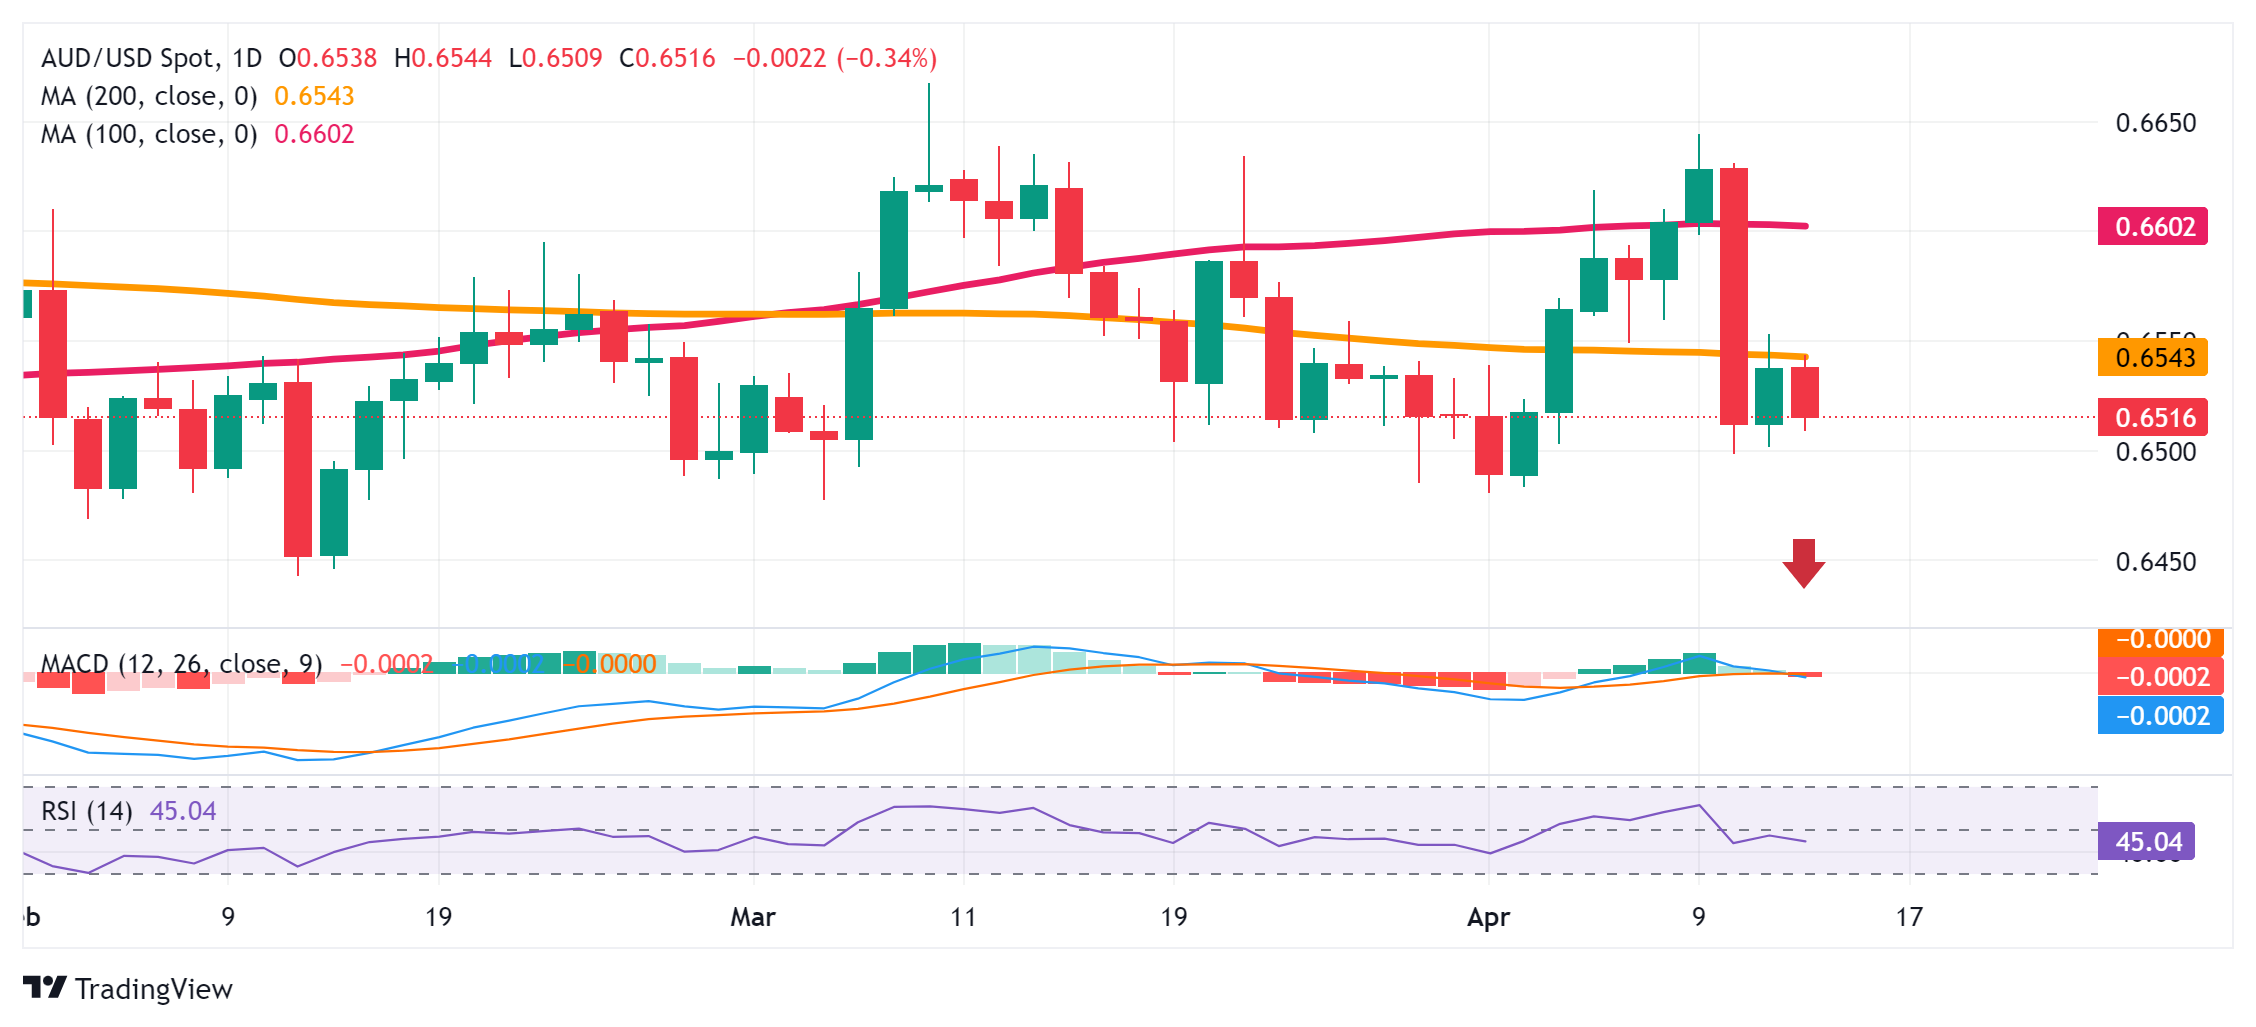
From a technical perspective, the AUD/USD pair, so far, has managed to defend the 0.6500 mark, which should now act as a key pivotal point. Given that oscillators on the daily chart have just started gaining negative traction, a convincing break below will be seen as a fresh trigger for bearish traders and set the stage for an extension of the recent sharp pullback from the 0.6645 area, or a one-month high touched earlier this week.

Some follow-through selling below the 0.6480 area, or the monthly low, will reaffirm the negative bias and allow the AUD/USD pair to aim back to challenge the YTD trough, around the 0.6445-0.6440 region touched in February. The downward trajectory could extend further towards the 0.6400 mark en route to the next relevant support near the 0.6355-0.6350 zone.

On the flip side, any attempted recovery is likely to confront stiff resistance near the 0.6545-0.6555 region, which coincides with the very important 200-day Simple Moving Average (SMA). This is followed by the 100-day SMA, currently pegged near the 0.6600 mark, above which a bout of a short-covering move has the potential to lift the AUD/USD pair back towards the 0.6640-0.6645 area, or the monthly swing high.

AUD/USD daily chart

fxsoriginal

AUD/USD

Overview
Today last price0.6515
Today Daily Change-0.0023
Today Daily Change %-0.35
Today daily open0.6538
 
Trends
Daily SMA200.6549
Daily SMA500.6544
Daily SMA1000.6603
Daily SMA2000.6544
 
Levels
Previous Daily High0.6553
Previous Daily Low0.6502
Previous Weekly High0.6619
Previous Weekly Low0.6481
Previous Monthly High0.6667
Previous Monthly Low0.6478
Daily Fibonacci 38.2%0.6534
Daily Fibonacci 61.8%0.6521
Daily Pivot Point S10.6509
Daily Pivot Point S20.648
Daily Pivot Point S30.6458
Daily Pivot Point R10.656
Daily Pivot Point R20.6582
Daily Pivot Point R30.6611

Author

Haresh Menghani

Haresh Menghani is a detail-oriented professional with 10+ years of extensive experience in analysing the global financial markets.

More from Haresh Menghani
Share:

Markets move fast. We move first.

Orange Juice Newsletter brings you expert driven insights - not headlines. Every day on your inbox.

By subscribing you agree to our Terms and conditions.

Editor's Picks

EUR/USD could test 1.1750 amid strengthening bullish bias

EUR/USD remains flat after two days of small losses, trading around 1.1740 during the Asian hours on Thursday. On the daily chart, technical analysis indicates a strengthening of a bullish bias, as the pair continues to trade within an ascending channel pattern.

GBP/USD consolidates above mid-1.3300s as traders await BoE and US CPI report

The GBP/USD pair struggles to capitalize on the overnight bounce from the 1.3310 area, or a one-week low, and oscillates in a narrow band during the Asian session on Thursday. Spot prices currently trade around the 1.3370 region, down less than 0.10% for the day, as traders opt to wait on the sidelines ahead of the key central bank event risk and US consumer inflation data.

Gold awaits weekly trading range breakout ahead of US CPI report

Gold struggles to capitalize on the previous day's move higher back closer to the $4,350 level and trades with a mild negative bias during the Asian session on Thursday. The downtick could be attributed to some profit-taking amid a US Dollar uptick, though it is likely to remain cushioned on the back of a supportive fundamental backdrop. 

Dogecoin breaks key support amid declining investor confidence

Dogecoin trades in the red on Thursday, following a 4% decline on the previous day. The DOGE supply in profit declines as large wallet investors trim their portfolios. Derivatives data shows a surge in bearish positions amid declining retail interest.

Monetary policy: Three central banks, three decisions, the same caution

While the Fed eased its monetary policy on 10 December for the third consecutive FOMC meeting, without making any guarantees about future action, the BoE, the ECB and the BoJ are holding their respective meetings this week. 

Dogecoin Price Forecast: DOGE breaks key support amid declining investor confidence

Dogecoin (DOGE) trades in the red on Thursday, following a 4% decline on the previous day. The DOGE supply in profit declines as large wallet investors trim their portfolios. Derivatives data shows a surge in bearish positions amid declining retail interest.