|

AUD/USD Price Analysis: Aussie pulling back within an uptrend

  • AUD/USD has reached the bullish target for a price pattern that formed at the April 19 lows. 
  • It is currently correcting back but the overall uptrend suggests it will recover. 
  • Support from the zone around the trendline is likely to provide the springboard for a reversal higher. 

AUD/USD reached a key upside target on May 16 and has retraced. The pair is in a short-term uptrend and the pull back is likely to be a temporary correction before the uptrend continues.

AUD/USD 4-hour Chart


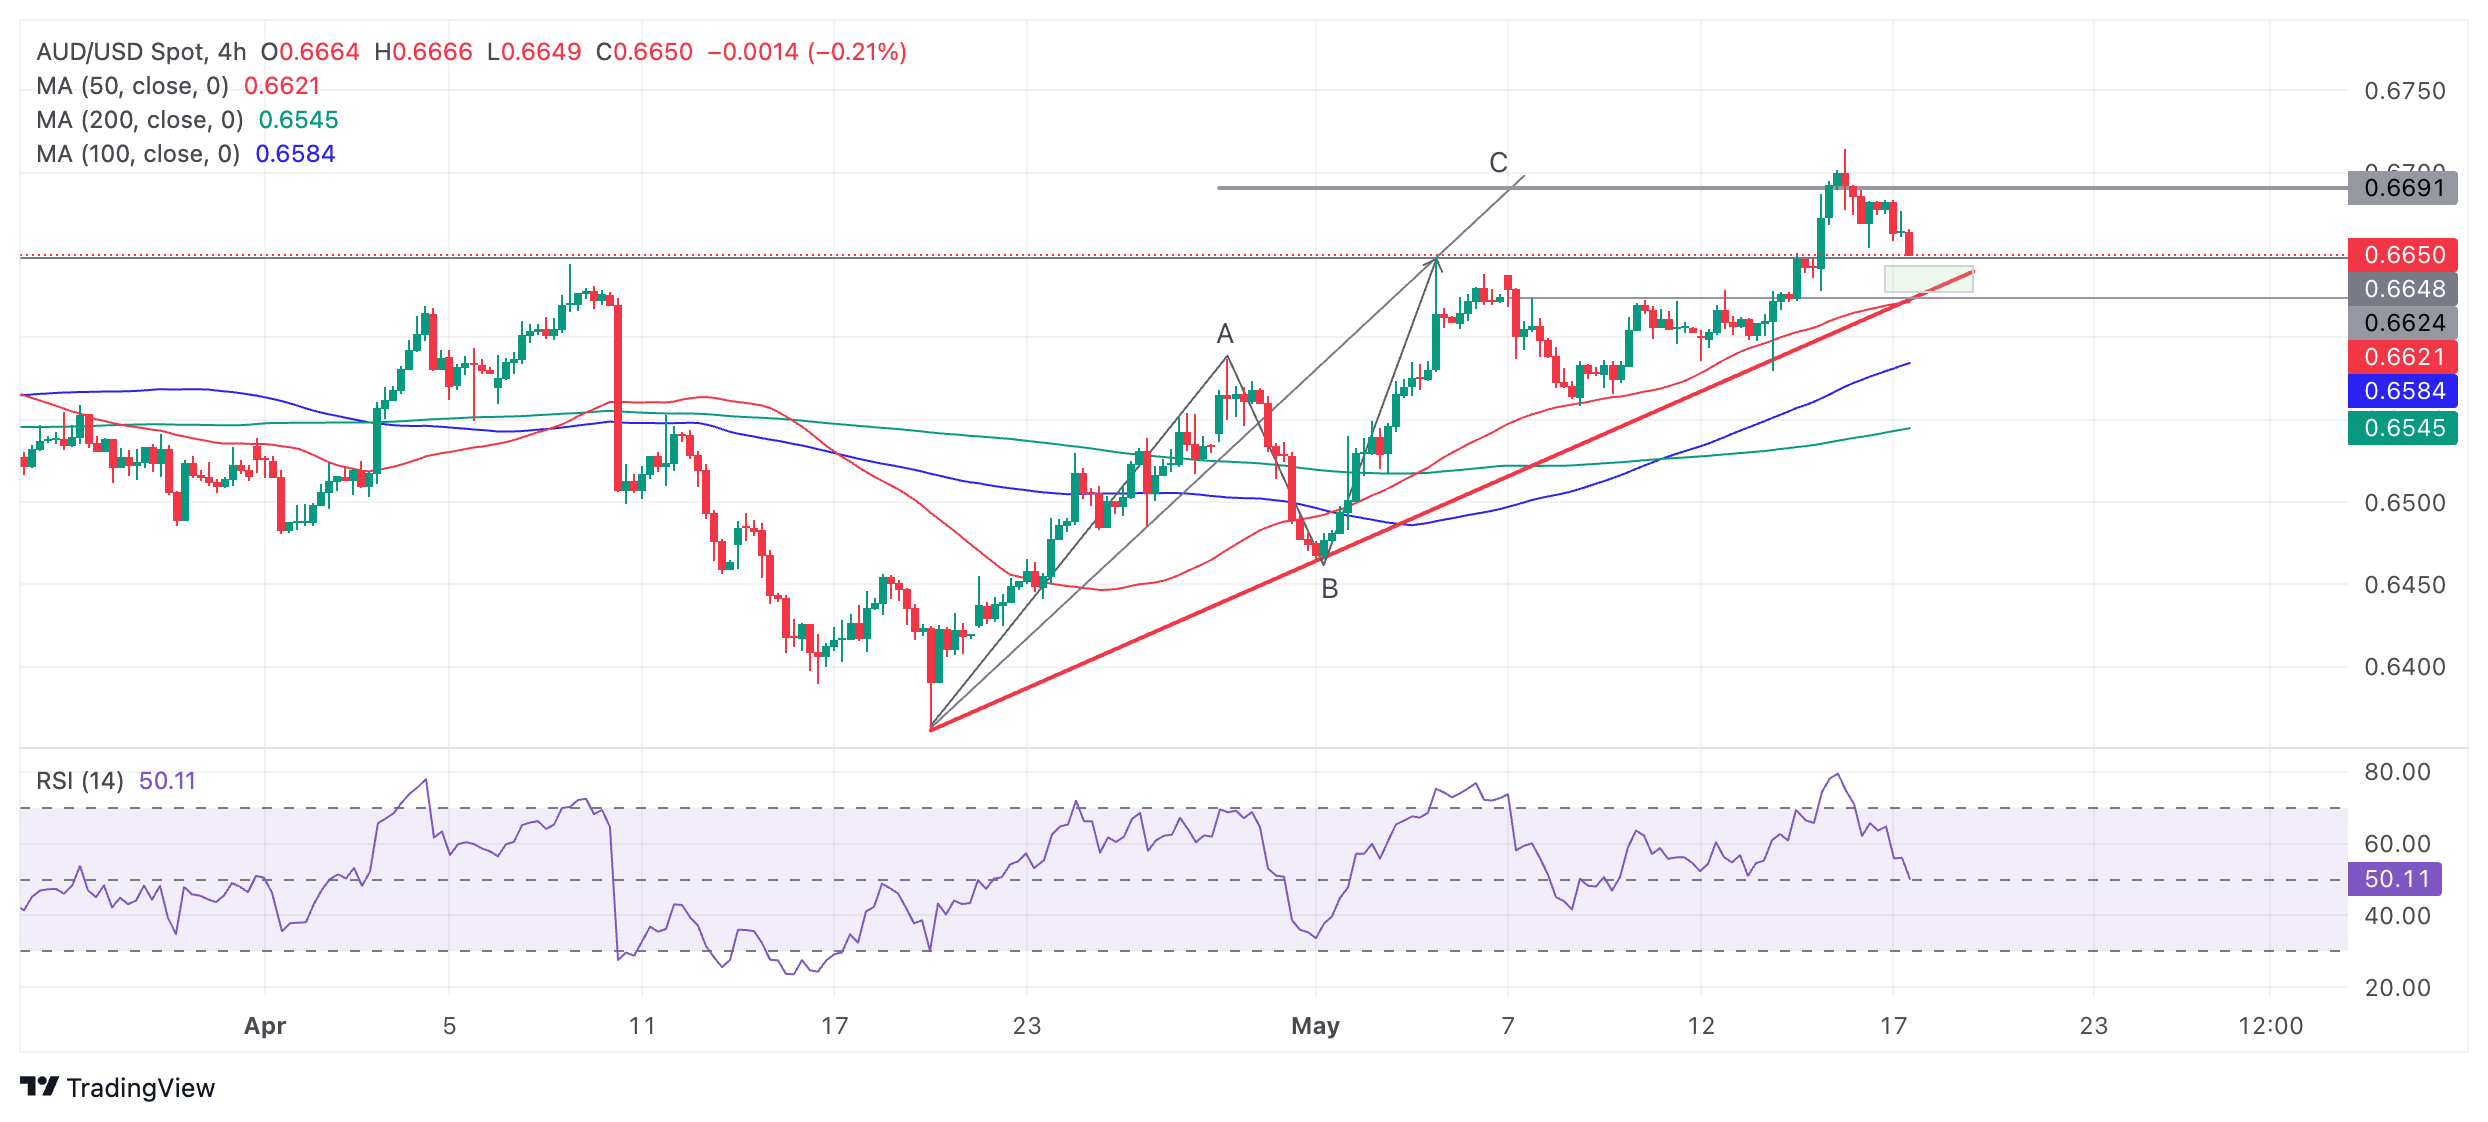
AUD/USD will probably find support at the red trendline for the move up and then reverse and start moving higher again. There are no signs yet it is resuming its uptrend however. 

A break above the 0.6714 high of May 16 will create a higher high and confirm a continuation of the uptrend. 

The pair has now reached the target for the Measured Move pattern which formed from the April 19 lows. Measured Moves are zig-zag like patterns composed of three waves, usually labeled A, B and C. The general expectation is that wave C will reach either the same length as A or a Fibonacci 0.681 ratio of A. 

Wave C has now fulfilled both these targets. 

A decisive break below the red trendline would be a bearish sign and could denote a change of the short-term trend.

Decisive would be characterized as a break that was accompanied by a long red candle that closed near its low or three red candles in a row that broke through the trendline.

Author

Joaquin Monfort

Joaquin Monfort is a financial writer and analyst with over 10 years experience writing about financial markets and alt data. He holds a degree in Anthropology from London University and a Diploma in Technical analysis.

More from Joaquin Monfort
Share:

Markets move fast. We move first.

Orange Juice Newsletter brings you expert driven insights - not headlines. Every day on your inbox.

By subscribing you agree to our Terms and conditions.

Editor's Picks

EUR/USD clings to small gains near 1.1750

Following a short-lasting correction in the early European session, EUR/USD regains its traction and clings to moderate gains at around 1.1750 on Monday. Nevertheless, the pair's volatility remains low, with investors awaiting this weeks key data releases from the US and the ECB policy announcements.

GBP/USD edges higher toward 1.3400 ahead of US data and BoE

GBP/USD reverses its direction and advances toward 1.3400 following a drop to the 1.3350 area earlier in the day. The US Dollar struggles to gather recovery momentum as markets await Tuesday's Nonfarm Payrolls data, while the Pound Sterling holds steady ahead of the BoE policy announcements later in the week.

Gold stuck around $4,300 as markets turn cautious

Gold loses its bullish momentum and retreats below $4,350 after testing this level earlier on Monday. XAU/USD, however, stays in positive territory as the US Dollar remains on the back foot on growing expectations for a dovish Fed policy outlook next year.

Solana consolidates as spot ETF inflows near $1 billion signal institutional dip-buying

Solana price hovers above $131 at the time of writing on Monday, nearing the upper boundary of a falling wedge pattern, awaiting a decisive breakout. On the institutional side, demand for spot Solana Exchange-Traded Funds remained firm, pushing total assets under management to nearly $1 billion since launch. 

Big week ends with big doubts

The S&P 500 continued to push higher yesterday as the US 2-year yield wavered around the 3.50% mark following a Federal Reserve (Fed) rate cut earlier this week that was ultimately perceived as not that hawkish after all. The cut is especially boosting the non-tech pockets of the market.

Solana Price Forecast: SOL consolidates as spot ETF inflows near $1 billion signal institutional dip-buying

Solana (SOL) price hovers above $131 at the time of writing on Monday, nearing the upper boundary of a falling wedge pattern, awaiting a decisive breakout.