AUD/USD Price Analysis: Aussie bulls meet offers as risk-off impulse rebounds


  • A descending triangle formation indicates a volatility contraction in the asset.
  • Aussie bulls have failed to keep the asset above the 20-and 50EMAs.
  • The downside break of the chart pattern could drag the asset below the psychological support of 0.6000.

The AUD/USD pair has sensed selling pressure while attempting to test Wednesday’s high at 0.6300 in the Tokyo session. The pullback move in the asset has terminated as the risk-off impulse has rebounded amid soaring anxiety ahead of the US Consumer Price Index (CPI). Meanwhile, the US dollar index (DXY) has recovered its morning losses.

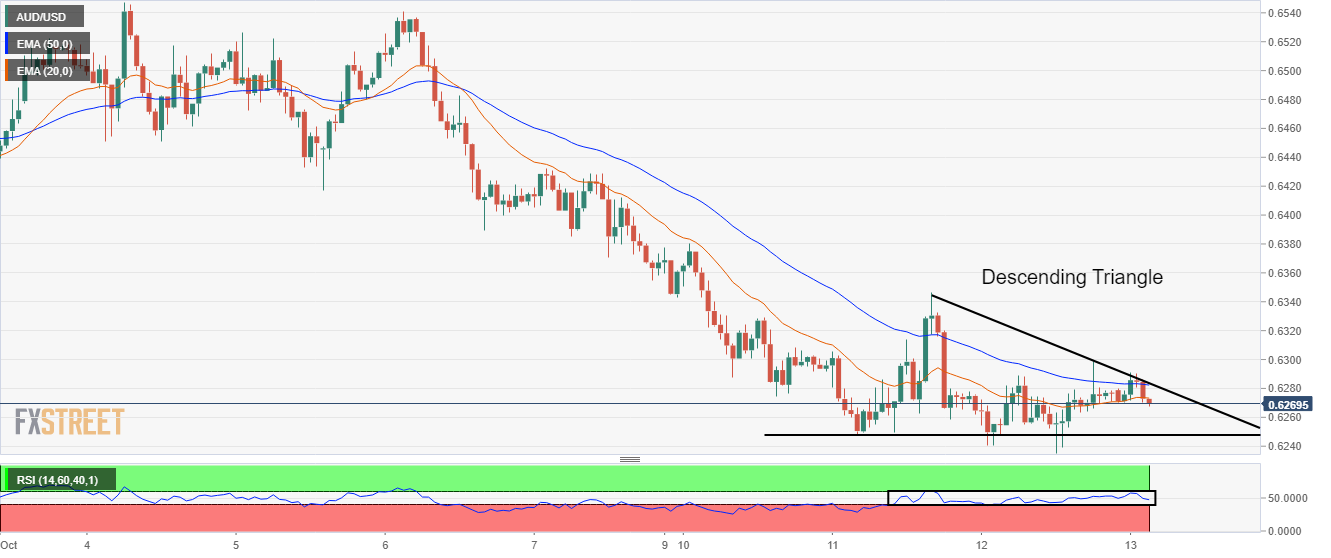
On an hourly scale, the asset is auctioning in a descending triangle chart pattern that indicates volatility contraction followed by wider ticks and heavy volume after an explosion. The horizontal support of the chart pattern is plotted from Tuesday’s low at 0.6247. While the downward-sloping trendline is placed from Tuesday’s high at 0.6346.

The antipodean has failed to keep the asset above the 20-and 50-period Exponential Moving Averages (EMAs) at 0.6274 and 0.6282 respectively.

Meanwhile, the Relative Strength Index (RSI) (14) is oscillating in a 40.00-60.00 range and has faced barricades while overstepping 60.00.

A downside break of Wednesday’s low at 0.6240 will drag the asset toward the round-level support at 0.6200 followed by April 2020 low at 0.5991.

On the flip side, a decisive break above October 4 high at 0.6548 will drive the asset toward the round-level resistance at 0.6600. A breach of the latter will expose the asset to smash the 50-EMA at 0.6661.

AUD/USD hourly chart

AUD/USD

Overview
Today last price 0.6273
Today Daily Change -0.0004
Today Daily Change % -0.06
Today daily open 0.6277
 
Trends
Daily SMA20 0.6504
Daily SMA50 0.6741
Daily SMA100 0.6852
Daily SMA200 0.7042
 
Levels
Previous Daily High 0.6299
Previous Daily Low 0.6235
Previous Weekly High 0.6548
Previous Weekly Low 0.6354
Previous Monthly High 0.6916
Previous Monthly Low 0.6363
Daily Fibonacci 38.2% 0.6275
Daily Fibonacci 61.8% 0.626
Daily Pivot Point S1 0.6242
Daily Pivot Point S2 0.6207
Daily Pivot Point S3 0.6178
Daily Pivot Point R1 0.6305
Daily Pivot Point R2 0.6334
Daily Pivot Point R3 0.6369


Share: Feed news

Information on these pages contains forward-looking statements that involve risks and uncertainties. Markets and instruments profiled on this page are for informational purposes only and should not in any way come across as a recommendation to buy or sell in these assets. You should do your own thorough research before making any investment decisions. FXStreet does not in any way guarantee that this information is free from mistakes, errors, or material misstatements. It also does not guarantee that this information is of a timely nature. Investing in Open Markets involves a great deal of risk, including the loss of all or a portion of your investment, as well as emotional distress. All risks, losses and costs associated with investing, including total loss of principal, are your responsibility. The views and opinions expressed in this article are those of the authors and do not necessarily reflect the official policy or position of FXStreet nor its advertisers. The author will not be held responsible for information that is found at the end of links posted on this page.

If not otherwise explicitly mentioned in the body of the article, at the time of writing, the author has no position in any stock mentioned in this article and no business relationship with any company mentioned. The author has not received compensation for writing this article, other than from FXStreet.

FXStreet and the author do not provide personalized recommendations. The author makes no representations as to the accuracy, completeness, or suitability of this information. FXStreet and the author will not be liable for any errors, omissions or any losses, injuries or damages arising from this information and its display or use. Errors and omissions excepted.

The author and FXStreet are not registered investment advisors and nothing in this article is intended to be investment advice.

XM
Account
7.2
Tools
9.2
Service
9.4
Trading
9.0
Trust
7.0
Experience
8.4
Read review
Moneta Markets
Account
7.4
Tools
6.6
Service
8.0
Trading
6.6
Trust
5.2
Experience
9.2
Read review
Trading Pro
Account
7.2
Tools
5.2
Service
6.6
Trading
8.0
Trust
5.0
Experience
7.0
Read review
Pepperstone
Account
8.2
Tools
8.2
Service
7.4
Trading
9.0
Trust
8.8
Experience
9.0
Read review
XM
Read review
Moneta Markets
Read review
Trading Pro
Read review
Pepperstone
Read review
Trading Pro
Read review
Pepperstone
Read review
XM
Read review
Moneta Markets
Read review
Trading Pro
Account
7.2
Tools
5.2
Service
6.6
Trading
8.0
Trust
5.0
Experience
7.0
Read review
Pepperstone
Account
8.2
Tools
8.2
Service
7.4
Trading
9.0
Trust
8.8
Experience
9.0
Read review
XM
Account
7.2
Tools
9.2
Service
9.4
Trading
9.0
Trust
7.0
Experience
8.4
Read review
Moneta Markets
Account
7.4
Tools
6.6
Service
8.0
Trading
6.6
Trust
5.2
Experience
9.2
Read review

Recommended content


Recommended content

Editors’ Picks

AUD/USD: Bulls need to clear the 200-day SMA

AUD/USD: Bulls need to clear the 200-day SMA

AUD/USD treaded water around 0.6360 after once again faltering near recent tops in the 0.6440 zone, always on the back of the intense recovery in the US Dollar. In the meantime, positive headlines on the US-China trade front could help the Aussie stay in the upper end of the range for the time being.

AUD/USD News
EUR/USD strengthens above 1.1300 on gloomy Fed’s Beige Book

EUR/USD strengthens above 1.1300 on gloomy Fed’s Beige Book

The EUR/USD pair edges higher to around 1.1335 during the early Asian session on Thursday. Mitigating concerns over potential tariff threats by US President Donald Trump exerts some selling pressure on the US Dollar.  

EUR/USD News
Gold corrected extreme conditions, struggles around $3,300

Gold corrected extreme conditions, struggles around $3,300

Gold extended its decline on Wednesday, slipping below the $3,300 mark per troy ounce in response to reports from the media suggesting the Trump administration is weighing tariff reductions on Chinese goods, a news that revived hopes of easing trade tensions and reduced demand for the yellow metal as a safe-haven asset.

Gold News
TRUMP meme coin rallies following announcement of President Trump's upcoming dinner with top 220 holders

TRUMP meme coin rallies following announcement of President Trump's upcoming dinner with top 220 holders

Official TRUMP rallied 50% on Wednesday after the team behind the meme coin announced plans for its top 220 token holders to have a dinner with President Donald Trump in May. The announcement also included an extension of the token's initial unlock plan by an additional 90 days.

Read more
Five fundamentals for the week: Traders confront the trade war, important surveys, key Fed speech

Five fundamentals for the week: Traders confront the trade war, important surveys, key Fed speech Premium

Will the US strike a trade deal with Japan? That would be positive progress. However, recent developments are not that positive, and there's only one certainty: headlines will dominate markets. Fresh US economic data is also of interest.

Read more
The Best brokers to trade EUR/USD

The Best brokers to trade EUR/USD

SPONSORED Discover the top brokers for trading EUR/USD in 2025. Our list features brokers with competitive spreads, fast execution, and powerful platforms. Whether you're a beginner or an expert, find the right partner to navigate the dynamic Forex market.

Read More

Forex MAJORS

Cryptocurrencies

Signatures

Best Brokers of 2025