|

AUD/NZD Price Forecast: Aussie down but uptrend remains intact, AUD/NZD into 1.0900

  • The AUD/NZD is falling back after peaking on Wednesday.
  • Antipodean cross pair is cycling familiar territory as bulls refuse to go down.
  • AUD losing upside momentum could signal another turn towards the downside.

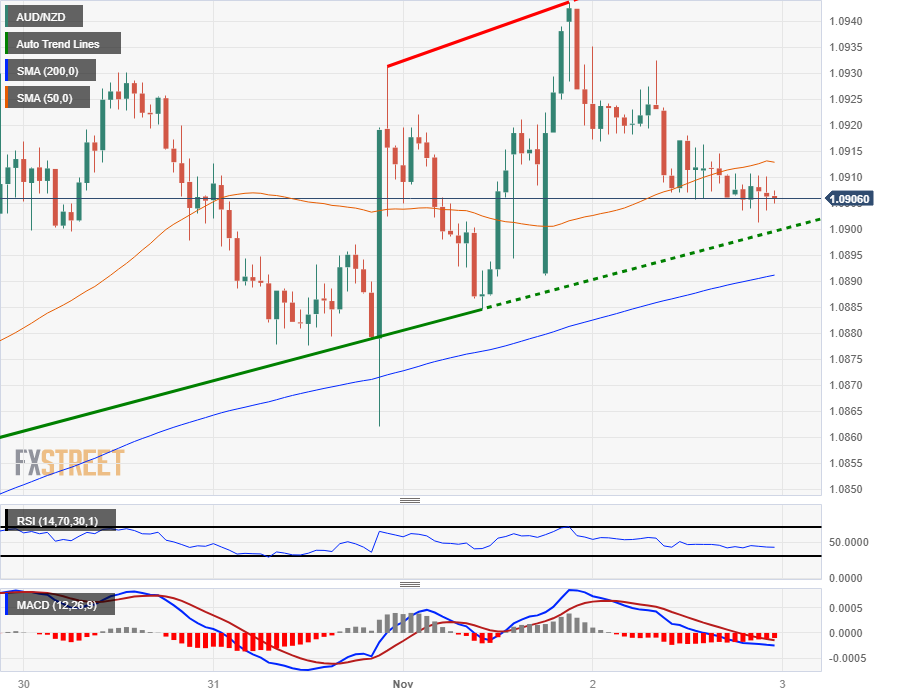
The AUD/NZD is trading back into the 1.0900 handle, a level that has been trapping the cross pair for most of 2023. 

The Aussie (AUD) has seen a firm recovery since bottoming out in early October near 1.0625, but bullish momentum appears to be draining out of the charts quickly as intraday action begins to print exhaustion patterns.

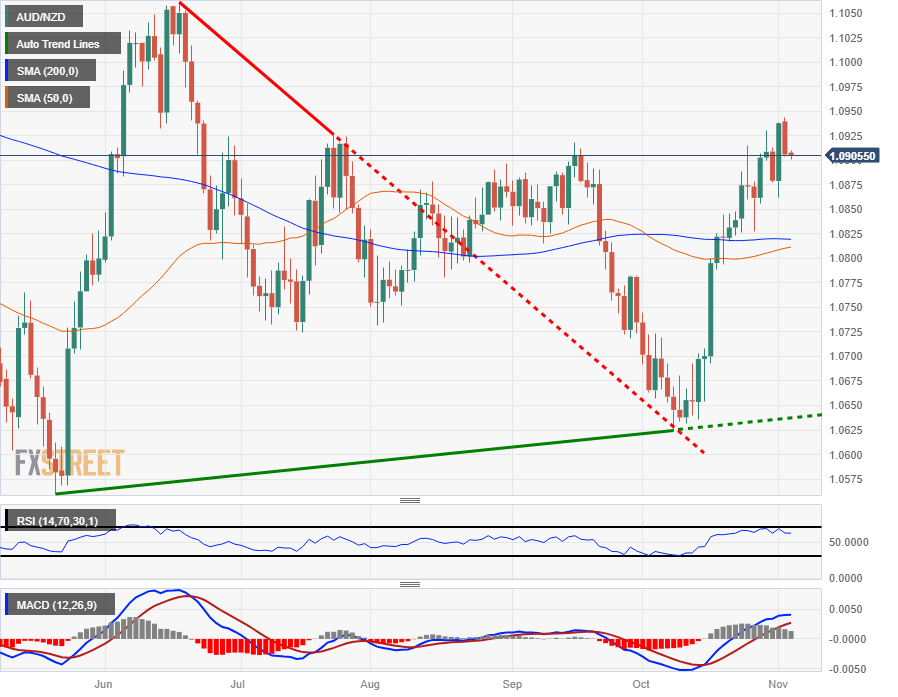
On the daily candlesticks, the Relative Strength Index (RSI) has begun to roll over into a bearish trend after tipping into overbought territory last week, but traders will note that the Moving Average Convergence-Divergence (MCAD) oscillator still hasn't seen a slow-MA crossover confirming aa bearish bias in candlesticks yet.

The median point for price action currently sits near 1.0825 where the 50-day and 200-day Simple Moving Averages (SMA) are currently converging as long-term momentum drifts into the middle.

AUD/NZD Hourly Chart

AUD/NZD Daily Chart

AUD/NZD Technical Levels

AUD/NZD

Overview
Today last price1.0906
Today Daily Change-0.0032
Today Daily Change %-0.29
Today daily open1.0938
 
Trends
Daily SMA201.0784
Daily SMA501.0809
Daily SMA1001.0825
Daily SMA2001.082
 
Levels
Previous Daily High1.0939
Previous Daily Low1.0862
Previous Weekly High1.0915
Previous Weekly Low1.0823
Previous Monthly High1.093
Previous Monthly Low1.0624
Daily Fibonacci 38.2%1.091
Daily Fibonacci 61.8%1.0891
Daily Pivot Point S11.0887
Daily Pivot Point S21.0836
Daily Pivot Point S31.081
Daily Pivot Point R11.0964
Daily Pivot Point R21.099
Daily Pivot Point R31.1041

Author

Joshua Gibson

Joshua joins the FXStreet team as an Economics and Finance double major from Vancouver Island University with twelve years' experience as an independent trader focusing on technical analysis.

More from Joshua Gibson
Share:

Editor's Picks

AUD/USD consolidates above 0.7000/two-month low; bearish potential intact

The AUD/USD pair oscillates in a narrow range during the Asian session, and moves little following the release of mixed inflation figures from China. Spot prices currently trade around the 0.7025 region, nearly unchanged for the day, and remain within striking distance of a nearly two-month low set on Tuesday. Renewed hostilities between the US and Iran temper hopes for a deal to end the over three-month-old war.

Japanese Yen languishes despite wholesale inflation accelerates in May

USD/JPY flatlines after experiencing volatility, trading around 160.40 during the Asian hours on Wednesday. The pair continues to hold its ground, reflecting a struggling Japanese Yen that has failed to find support despite a massive acceleration in wholesale inflation. Driven by surging energy costs linked to the ongoing Middle East conflict, Japan’s Producer Price Index jumped 6.3% year-over-year in May. This hot printing comfortably outpaced April’s upwardly revised 5.3% figure and surpassed market consensus of 5.5%, marking the fastest pace of wholesale price growth in three years.

$4,200: Gold retains bearish bias near March low ahead of US CPI

Gold recovers slightly after touching a fresh low since March 23, though it retains a bearish bias near the $4,200 mark through the early European session. Renewed hostilities between the US and Iran fuel inflationary concerns and bolster bets for more hawkish central banks, which is seen as a key factor driving flows away from the non-yielding yellow metal. Furthermore, the decline could be attributed to technical selling following the recent breakdown below the very important 200-day SMA.

Cardano's downtrend deepens despite on-chain bottoming signals

Cardano edges lower to $0.1600 signaling a potential extension of the 30% loss from last week. The altcoin remains under intense selling pressure, weighing on its retail support. Still, a spike in dormant supply re-entering circulation signals that the selling pressure has run its course, a pattern that often precedes a rebound.

US CPI data set to show inflation at three-year high in May, backing Fed hawkish tilt

The US Bureau of Labor Statistics will publish the May Consumer Price Index (CPI) data on Wednesday. The report is expected to show another step up in consumer inflation, driven by the persistently high Oil prices due to the ongoing crisis in the Middle East.

The US economy defies the rules: 100 days into the Oil shock and the recession signal is still missing

More than three months after the start of the Iran war and the resulting disruption to global energy markets, the US economy continues to display remarkable resilience. The conflict has triggered a sharp rise in Oil prices, reignited inflationary pressures and fueled widespread concerns about a potential economic slowdown.