AUD/NZD Price Analysis: Wednesday’s Doji candlestick shifts focus from 33-month-old support
- AUD/NZD struggles to defend the bounce off yearly low.
- Oversold RSI conditions, Wednesday’s Doji candlestick signal further recovery.
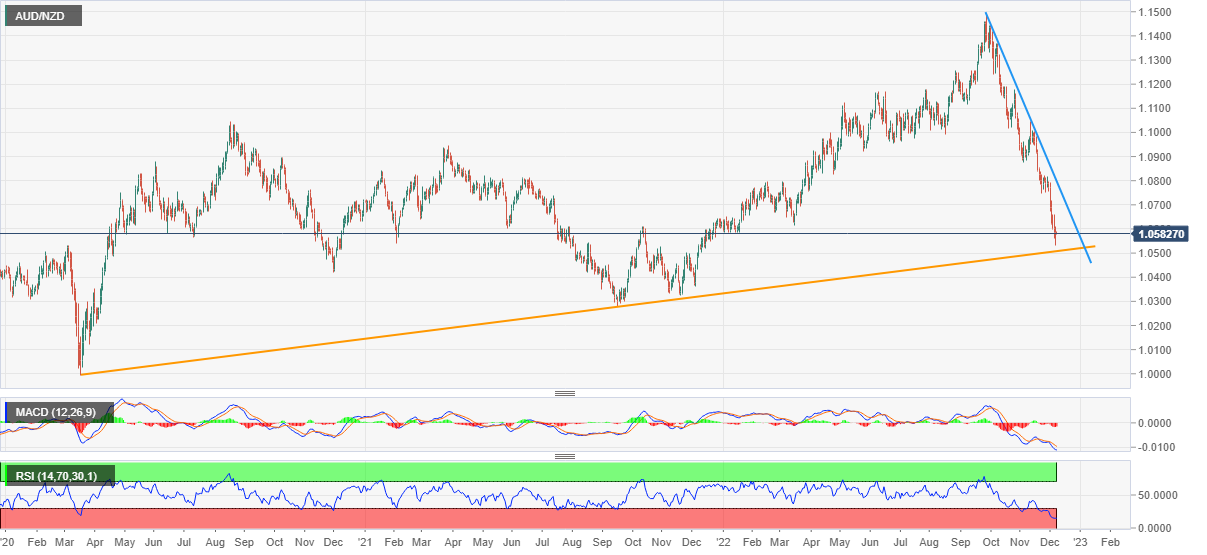
- Ascending trend line from March 2020 appears to be the key support.

AUD/NZD remains sidelined around 1.0585 during Thursday’s Asian session, after bouncing off the yearly low the previous day. In doing so, the quote justifies Wednesday’s Doji candlestick, as well as oversold conditions of the Relative Strength Index (RSI) line, placed at 14.
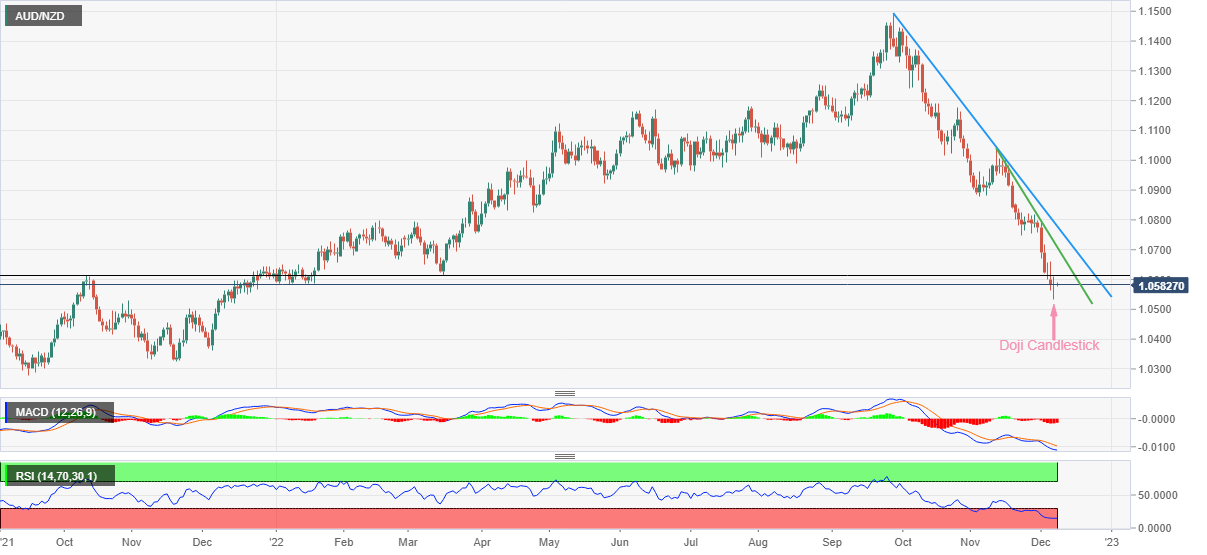
AUD/NZD: Daily chart
A closer look at the chart shows that the recovery needs validation from a horizontal resistance line comprising October 2020 top and March 2022 low surrounding 1.0610-15.
Even so, downward-sloping resistance lines from November 11 and September 28, respectively near 1.0710 and 1.0780, challenge the AUD/NZD pair’s further upside.
It’s worth noting, however, that the pair’s successful break of 1.0780 enables the AUD/NZD bulls to retake control.
AUD/NZD: Daily chart
Alternatively, an ascending trend line from March 2020, around 1.0500, appears the key support for the AUD/NZD pair bears to watch during the quote’s further downside.
Following that, the quote’s gradual downside towards the lows marked in November and September of 2021, close to 1.0325 and 1.0280 in that order, can’t be ruled out.
Overall, AUD/NZD is likely to witness a corrective bounce but the recovery has a long way to go before convincing the buyers.
Author

Anil Panchal
FXStreet
Anil Panchal has nearly 15 years of experience in tracking financial markets. With a keen interest in macroeconomics, Anil aptly tracks global news/updates and stays well-informed about the global financial moves and their implications.


